Understanding Stock Market & Economic Cycles
by Rob Stoll, CFP®, CFA, Financial Advisor & Chief Investment Officer / May 11, 2023
The economy and stocks are always in a cycle. We don’t notice the ‘cycle’ too much when the economy is growing and stocks are going up. But when these economic cycles turn negative, everyone wonders what’s going to happen next.
We are in one of those moments now. Following-up on one of our video blog posts, I thought it would be good to walk through how these cycles usually play out. Having a good understanding of how stock market and economic cycles work is important to the health of your finances. When we replace emotion with logic and knowledge, it helps us make better decisions.
The Basics of Stock Market and Economic Cycles
The first thing to understand about market cycles is that no two cycles are alike. Going back through history, there have always been unique causes for each of the cycles we’ve endured. Wars, inflation, terrorist attacks, housing bubbles, and a pandemic. These are hard to predict, which is why trying to time your investments for cycles is impossible.
While each cycle is unique, they all tend to follow the same pattern. The economy can expand for several years at a time. As it does, consumer and business confidence gains steam. And as that happens, it inevitably leads to excessive speculation and over-reliance on debt.
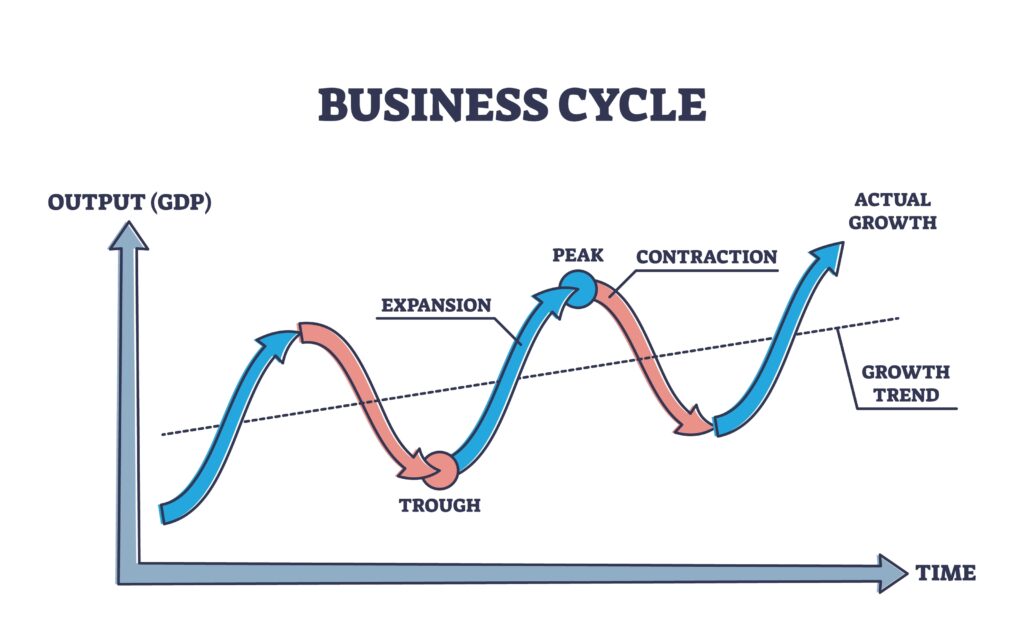
At the peak of the cycle, there’s usually a trigger that causes a contraction. Many times it’s the Federal Reserve raising interest rates to prevent the economy and inflation from overheating. Suddenly the cost of speculating rises (i.e. interest rates go up). Asset prices and business activity that was supported by low rates declines, and it continues until there’s a trough.
Is This Economic Cycle Like Any We’ve Seen Before?
The current economic cycle we’re in is unique because stocks and the economy have been whipsawed like crazy the last few years. In 30 months, we’ve gone from a white-hot economy (pre-pandemic) to economic “depression” at the height of the COVID-19 pandemic, back to a white-hot economy.
While the current economic cycle is different, I think the current stock market cycle has good precedent. The two periods that come to mind are the 1974-1975 cycle and the 2000-2003 cycle. Prior to both cycles, large growth stocks dominated the stock market. The stock market became very concentrated in these large growth stocks. But eventually there was a “trigger” for the cycle turn, with inflation being the trigger in 1974 and aggressive interest rate hikes by the Fed in 2000.
Below I’ll walk through the stages of a stock market cycle, using 2000-2003 as a guide, as that seems to me the most applicable to our current situation. Then I’ll talk about what we’ve done to protect our clients from the down cycle. If you want to learn more about how we work with our clients comprehensively, check out our process page!
Stage 1: Trigger at the Top
Cycles normally don’t roll over of their own volition. At each turn, whether it’s at the peak or the trough of a cycle, there’s a change in environment that triggers a turn in the cycle.
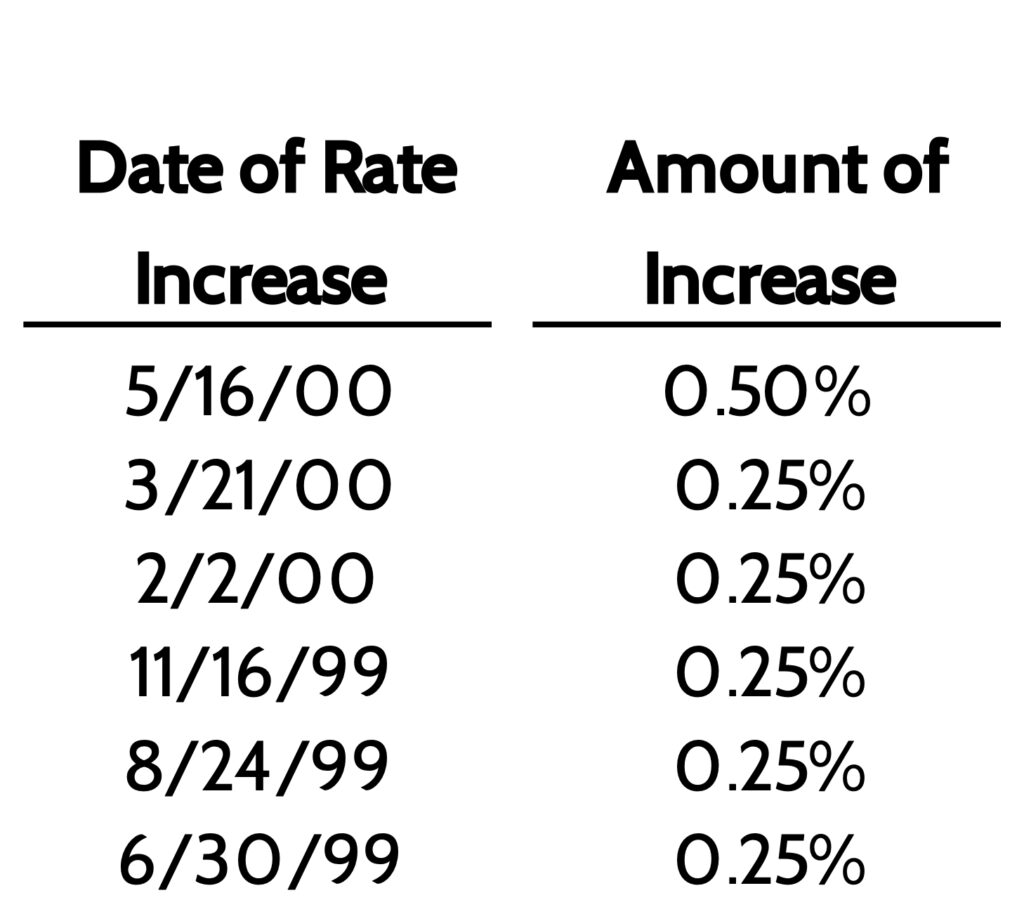
In the 2000-2003 cycle, it was an increasingly aggressive Federal Reserve that triggered the top. Worried about run-away stock prices, the Fed raised interest rates in mid-1999, culminating with a half-point rate hike (0.50%) in May 2000. Coincidentally, that was the last half-point rate hike until just a few weeks ago.
This time around, all it took was a meaningful change of tone from the Federal Reserve in November 2021 to trigger the current cycle. Remember, from March 2020 through November 2021, the Federal Reserve unleashed the most stimulative monetary policy we’re ever likely to see in our lifetimes. As recently as October 2021, the Fed insisted that they’d keep policy accommodative for as long as necessary. Surging inflation in 2021 changed that.
On November 3, 2021, the Fed concluded its regularly scheduled meeting and gave a press conference. There was a marked shift in tone from Fed Chair Jerome Powell. Inflation was now a “problem” and the Fed was going to tighten policy to deal with it. That meeting marked the top of the current cycle, setting the stage for what we’re seeing today.
Stage 2: Wringing out Speculative Excesses
With the benefit of hindsight, it’s remarkable to see how that one Fed meeting completely changed investor attitude towards “go-go” growth stocks. Before that meeting, we were in the middle of one of the craziest stock speculative bubbles in a long time. Companies with little earnings and revenues were being awarded valuations over $50 billion, based solely on hopes for future growth, very similar to what we saw in early 2000.
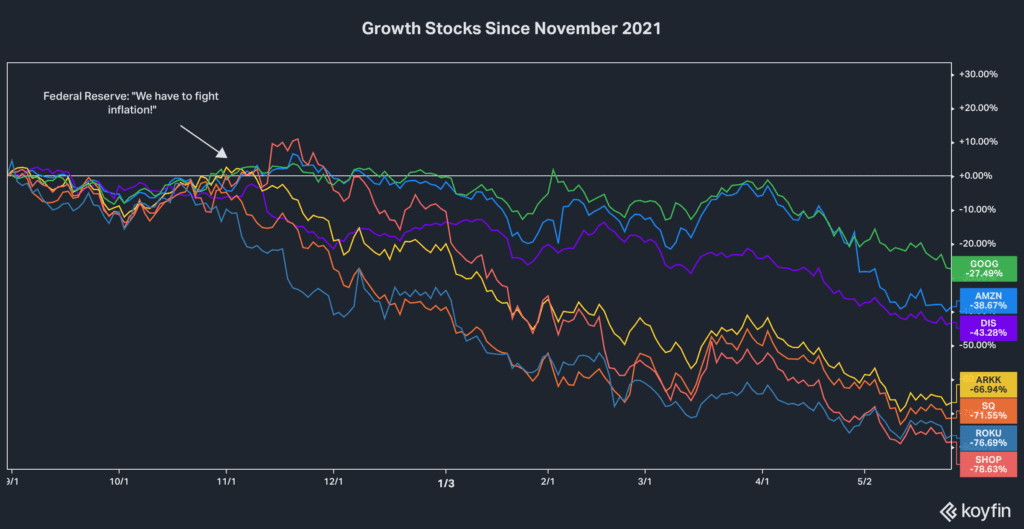
You can see that almost to the day (November 3, 2021) the stocks of a wide range of growth companies rolled over. The most speculative of these investments have seen the most air come out of them. I’ll pick on the ARK Innovation ETF (Ticker: ARKK) since they went all-in on every no-name, no-profit speculative stock they could get their hands on. That ETF is down 67% from November. The cryptocurrencies, Bitcoin and Ethereum, are both down >50% since then.
I firmly believe that when history is written on the 2020-2021 period, historians are going to conclude that we witnessed one of the biggest speculative bubbles in history. The crypto “ecosystem” takes center stage. The entire space is a Ponzi scheme that depends on duping new investors into buying in. Over the last two years, we’ve seen every snake oil salesman and fraudster get into crypto because it was easy money. I suspect there will be little left of this space when it’s over, other than hard-core “crypto bros” who think they’re sticking it to the man by investing in Bitcoin.
We will completely purge these excesses from financial markets. As painful as it will be for these companies, their employees, and investors, wringing these excesses out of the market has to take place in order for the next up-cycle to begin.
Stage 3: Pricing in a Recession
One misunderstood aspect of the Federal Reserve fighting inflation is how they fight inflation. Yes, they raise interest rates to “cool” the economy. But what does that mean?
What the Fed is trying to accomplish by raising interest rates is to cool demand for goods and services. Back in Econ 101, we learned that higher demand = higher prices, assuming supply stays the same. The corollary to this is that prices will only come down once demand comes down.
While the Fed would never utter this in public, the only way to cool demand is to cause an economic recession. Recessions are like a “reset” button for inflation. Every time the Fed has endeavored to control inflation, they’ve caused a recession. In public, they’ll talk about engineering a “soft landing” for the economy. But that rarely happens.
I believe we’re in the early part of Stage 3 right now (May 2022). The “tell” that we’re entering this stage is that US Treasury bonds have acted better. The first four months of 2022 saw the worst start for bonds in any year since 1981. That’s because investors were pricing in higher interest rates by the Fed.
But over the last three weeks, there’s been a distinct shift in the performance of stocks and bonds. Instead of both going down in unison, bonds have started to go up on days that stocks are down.
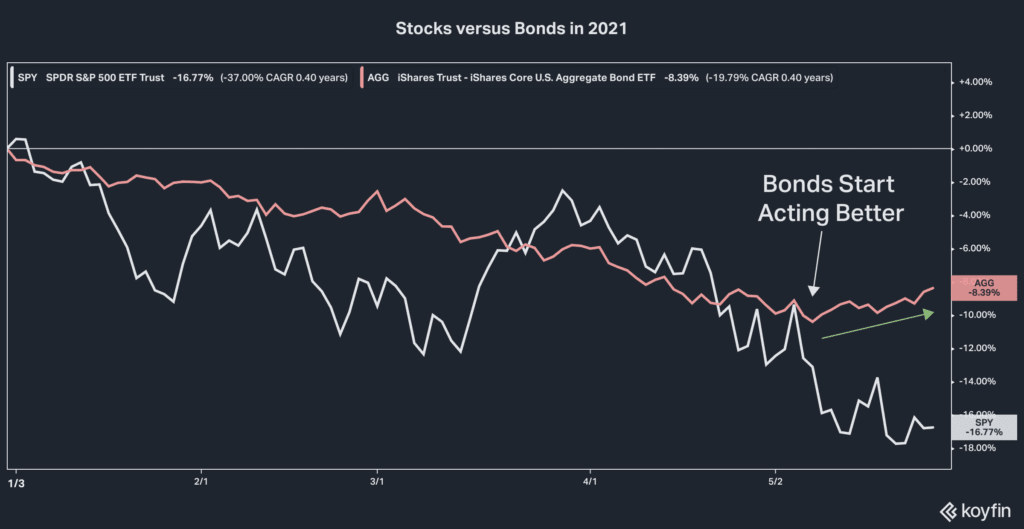
Since the start of May 2022, the S&P 500 index is -5.0% but the Aggregate Bond index (reddish line) is +1.7%. As you can see from the chart above, both stocks and bonds were down about 10% through April.
This is precisely the dynamic we normally see as the stock market prices in a recession. Investors move from the uncertainty of the stock market to the safety and comfort of US Treasury bonds.
While no one likes a recession, seeing bonds catch a bid should come as a tremendous relief to many investors. The traditional “60/40” portfolio (60% stocks, 40% bonds) was off to a terrible start this year. Seeing bonds catch a bid will help stabilize a meaningful portion of investor portfolios and provide ammunition to rebalance into stocks later in the cycle.
Stage 4: Recession Leads to Balance Sheet Cleanup
The most difficult part of the contraction part of the cycle is the actual recession. This is where job losses and economic write-downs happen. It’s painful for some people and companies. But it’s a critical ingredient needed to get back to the next up-cycle. Let me explain.
We are 4 years away from celebrating the 250th anniversary of our country’s founding. That the US has lasted and prospered this long is unique in human history. One of the key reasons we’ve prospered this long is because we live in a free and capitalist society. Individuals are free to reach for any dream they want. They’re also responsible for their choices.
Business cycles are an important part of sustaining long-term growth as a nation. When capital gets mis-allocated – as it has in crypto and overvalued tech stocks – it leads to a collapse in economic productivity and an increase in inequality. Money chases speculative ventures rather than getting invested in sustainable growth projects.
In every speculative up-cycle, there are companies and investors that get over their skis. They take on too much debt and have too much exposure to the “hottest” parts of the economy. As prices correct, they end up suffering losses.
However, their losses turn into opportunities for others in the next up-cycle. Look at today’s housing markets. Current home owners have celebrated a surge in home prices. The last two years have been great.
But ask a 20-something Millennial trying to start a life and a family what it’s like to not be able to buy a home because prices have gone up so much. And now they face higher rents because investors are snapping up apartments and jacking up monthly rents? Speculative excesses cause actual damage to large parts of society.
For the stock market, this is the part of the cycle where weak, over-leveraged companies suffer. Many made poor business decisions, such as levering up their balance sheet to buy Bitcoin (see: MicroStrategy Incorporated). Cleaning up these excesses corrects dislocations in our economy and society.
Stage 5: Who’s Swimming Naked?
The last stage of a contraction is the “Who’s Swimming Naked?” stage. This phrase was coined by Warren Buffett a long time ago, saying, “When the tide goes out, you find out who’s swimming naked.” I view this stage as the final crescendo of a down-cycle because it represents a final cleansing of excesses.
The 2000-2003 cycle was a great example of this. The downturn started as a run-of-the-mill downturn, purging speculative excesses in the DotCom space. But as the tide went out, illegal activity was exposed.
Starting in 2001, one big corporate scandal after another happened. Enron. WorldCom. Tyco International, just to name a few. These companies were engaged in outright accounting fraud, which they were able to hide in the good times.
Once the economy turned against them, they could no longer fudge the numbers. One by one, these stories came out and damaged investor confidence. People went to jail. They enacted new laws to “stop” this from happening in the future. I’d also note that Bernie Madoff’s Ponzi scheme only came to light in the depths of the 2008 downturn.
Investing is a confidence game and the reason I think this is the final capitulation stage is because investors lose whatever confidence they had left. If you can’t trust companies to be honest, who can you trust?
But this is where future investment opportunities are born. It wrings out the dirty players and in their place a better, cleaned up system takes its place. The next upturn is born and we do it all over again.
Don’t Forget That Upturns Always Follow Downturns!
It’s critical to remember that after these stages, an upturn ALWAYS follows. Let me say that again: Upturns always follow Downturns. Too often, when we’re in a downturn, I find people get tricked into believing that things will never recover. They will. No matter how bad things have gotten, the U.S. has always rebounded.
The greatest investment opportunities are all born in downturns. Warren Buffett staked his claim as the greatest investor ever in the depths of the 1974 bear market. Investors who avoided selling at the bottom of previous downturns in 2003, 2009, and 2020 found rewards in significant rebounds in the market.
These rebounds often start at moments when they make the least sense. “Things are so bad right now, how can the market be rallying?!?” The reason markets bottom out before the economy does is because markets are forward-looking. It’s not what’s happening today that matters. It’s what the market thinks is going to happen in 6-12 months that does.
I’ve learned the hard way in my career not to be dogmatic about my investment views. Meaning, if I’m concerned today, that doesn’t influence being able to turn optimistic tomorrow. Conviction in a thesis is great, but when it turns into dogmatic religion, then you’ve lost the battle. Be nimble. While we have our concerns about speculative excesses today, if market conditions change in such a way that optimism is warranted, we’ll follow that.
Question: If You Think a Downturn is Coming, Why not Get Out?
This is a question that comes up from time to time. “Rob, if you’re worried about these excesses, why not get out of the market and wait for it to run its course?”
It’s a very fair question and I hope you come away understanding our approach. In short, neither myself nor anyone else can predict how the future will play out.
I’ve voiced my concerns about parts of the investment landscape for over two years now. See HERE, HERE, HERE, HERE, HERE, HERE, and HERE. Heck, I was even warning my old bosses in 2016 about excesses, before I was even a financial advisor!
Had we taken action to “cash out” back then, clients would’ve missed out on big gains. Who would’ve been happy to be sitting in cash during 2020 and 2021 when the S&P 500 was +18% and +31%, respectively? No one.
So how do we express concerns about excesses and cycles in client portfolios?
We first remind ourselves and our clients that their target investment strategy is a “through the cycle” strategy. Meaning, you’ll have some years with investment returns above normal, and some below normal. Averaged out over long time horizons – which most people have, even if they’re retired – investors will get close to “normal” returns.
Second, we have an active rebalancing process to keep client portfolios in-line with their target investment allocation. Large moves in stocks and bonds can move an investment mix too far away from the target. It’s an enforced “buy low, sell high” strategy where winners are being trimmed with proceeds getting recycled into laggards.
Finally, we are extremely careful with how we construct client portfolios. This is where we tangibly express our views about the market and cycle. I’ll run through some examples in a moment. But the point is that we consciously try to avoid overly speculative parts of the market and “tilt” portfolios towards parts of the market we think will hold up better in a downturn. You can read about our wealth management process to learn more.
Example: Avoiding Concentration Risk in the S&P 500
In an old blog post about the Nifty Fifty, we looked at the rise in concentration within the benchmark S&P 500 index. In short, it has become increasingly dominated by technology stocks, with the weight of that sector alone accounting for close to 30% of the total index.
It has been our view that shifting from a low inflation environment to a high inflation environment would put pressure on expensive tech growth stocks. So what did we do to protect against this?
We shifted client exposure from one type of S&P 500 index to another. The “normal” one weighs each company in the index according to what it’s worth. Putting $100 into the “normal” S&P 500 index means you’re getting $25 in just 10 stocks and $75 of the other 490. Too much concentration.
So we shifted to an equal-weight index fund that weights each company in the S&P 500 equally. Big, bad Apple is given the same weight in the index (0.20%) that Ralph Lauren is. If we look at concentration by sector, you can see the equal-weight version of the S&P 500 index is much more diversified, and has much less exposure to expensive technology stocks.
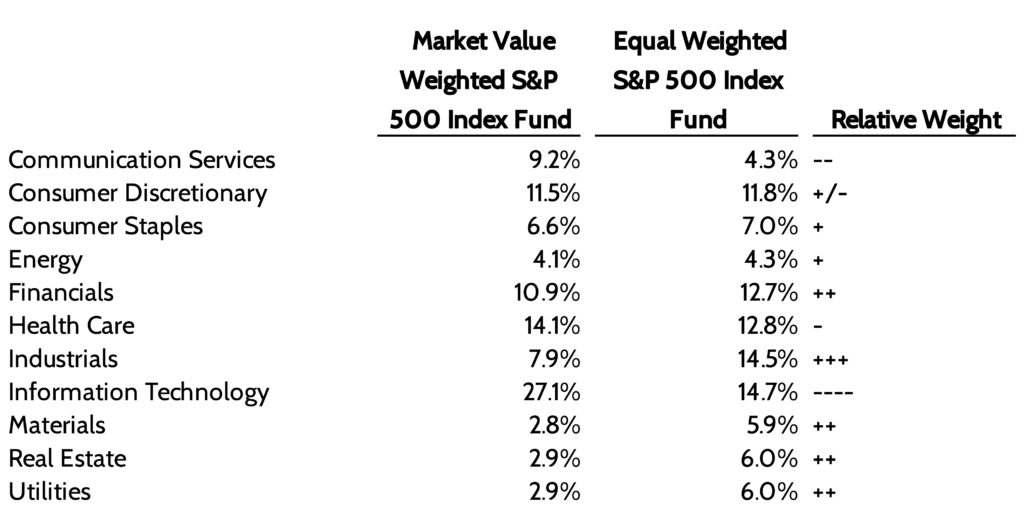
If our thesis about expensive growth stocks hitting a wall is correct, then the equal-weighted version of the S&P 500 index should do better.
Example: Owning Stronger Companies in Small Cap Stocks
Owning small company stocks (“small cap”) is an important diversifier in any investment portfolio. These companies grow faster and have historically generated stronger investment returns.
But not all small cap funds are the same. In fact, there’s a glaring deficiency in the most popular small cap index that most investors use, the Russell 2000 index. This particular index lets any Tom, Dick, & Harry small cap stock in the index. There’s no quality control. In fact, over 30% of Russell 2000 index members are unprofitable!
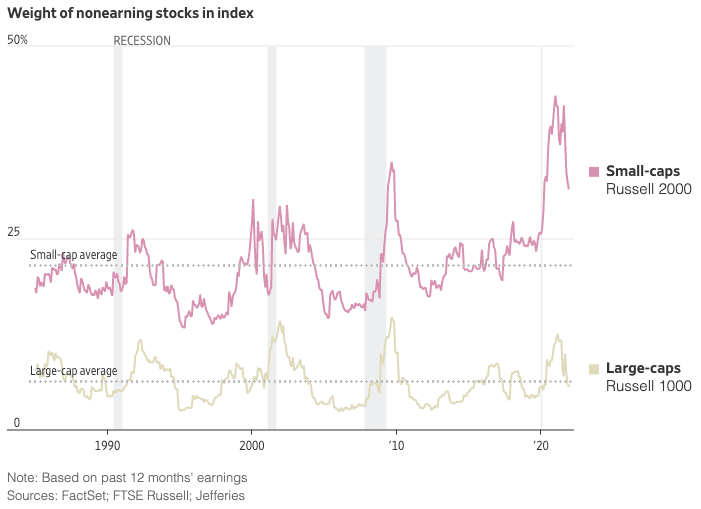
This is a huge problem if you’re heading into an economic downturn. Recessions hurt most companies, but they can kill unprofitable ones.
What have we done at FDS to give clients exposure to small cap stocks? We’ve invested in another small cap index, the S&P 600 index. In order find themselves in this index, a company must show consistent profitability. Yes, companies will lose money from time to time. But they won’t get in this index unless they’re normally profitable.
Has this made a difference? Yes! Over the last 12 months, small cap stocks are down. But there has been a marked difference in how the Russell 2000 small cap index has performed compared to the S&P 600 small cap index.

Example: Owning Higher Quality Bonds With Less Interest Rate Risk
The last example I’ll share of how we “tilt” client portfolios to reflect our views of the market and economy is on the bond side. If we are heading into an economic downturn, then that poses a greater risk to highly leveraged companies.
One consequence of the Federal Reserve’s ultra-loose monetary policy of the last 12 years is that it encouraged two behaviors:
1) It kept marginally rated companies in the “investment grade” index when in reality they should be in “junk” indexes;
2) Companies issued very long-term bonds, which are susceptible to moves in interest rates.
These two dynamics are summed up in the chart below. The blue line you see is the proportion of the “investment grade” index that has bond ratings at the lowest possible level for being considered investment grade (“BBB”). Almost 50% of investment grade bond indexes are in companies at the precipice of being downgraded to junk, which they likely will be in a recession.
Second, bond duration has skyrocketed as companies locked in very low interest rates for a long time. Higher bond duration = more interest rate risk, which is a key reason bonds have been so bad so far in 2021.
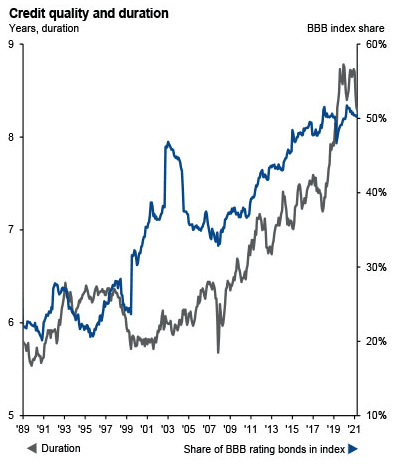
We’ve made conscious moves in the last 12 months to reduce interest rate risk (duration) in client portfolios. In addition, we recently shifted the credit ratings of the bonds held in client portfolios to include less “BBB”-rated companies and more AA and A-rated companies. We desire stronger balance sheets in economic downturns.
Understanding Stock Market & Economic Cycles
The takeaways I want everyone to get from this post are:
- We’ve been through economic cycles before.
- At the end of every down cycle is the beginning of a new up-cycle.
- Staying invested and well-diversified is better than trying to time these cycles.
- Having a disciplined rebalancing process in place helps take advantage of fast-moving markets (i.e. buying stocks if they drop).
- We’ve been actively “tilting” client portfolios away from the parts of the market we view as most risky, and moving those funds to higher quality stocks and bonds.
We never stand still when managing client portfolios, and we don’t take this responsibility lightly. While markets haven’t looked good at all this year, I’m very confident that the seeds are sown for the next up-cycle in the market.
We first need to rid the market of speculative excesses that have marked stock and bond markets for the last several years. As that happens, “who’s been swimming naked” headlines are possible. This is part of the process.
As opportunities arise, we will act quickly to “tilt” portfolios toward the next up-cycle. If no one is currently helping you with your investments and you’re not sure what to make of what’s going on, please reach out to us so we can help guide you.
Bonus: Our Retirement Planning Guide
Ready to take the next step?
Schedule a quick call with our financial advisors.


Recommended Reading
How Will AI Affect the Jobs Market?
White collar workers are wondering how AI will affect the jobs market, and their career. This article shares what's noise and what's real.

Rob Stoll, CFP®, CFA, Financial Advisor & Chief Investment Officer
Rob has over 20 years of experience in the financial services industry. Prior to joining Financial Design Studio in Deer Park, he spent nearly 20 years as an investment analyst serving large institutional clients, such as pension funds and endowments. He had also started his own financial planning firm in Barrington which was eventually merged into FDS.