Prepare for More Volatile Markets
by Rob Stoll, CFP®, CFA, Financial Advisor & Chief Investment Officer / May 20, 2021
Volatility is the price investors pay for making money in stocks and bonds. While no one can predict when periods of volatility will happen, there are clues we can look for that may signal an increase in volatility. We’ve been keeping our eyes on two dynamics which we believe create an environment for higher volatility. The first is a divergence between the stock market and a popular indicator for stock market volatility. The second is the surge in investor margin debt. Both suggest to us we should prepare for more volatile markets.
What Does Volatility Tell us About Markets?
There are general rules with volatility, and how the stock market is doing. First, periods of low volatility have been associated with markets that were steadily rising. Conversely, periods of high volatility have been associated with periods when stock markets were suffering draw downs, such as bear markets.
The difficulty with watching volatility is that it’s a chicken-and-egg kind of indicator. Which came first, the move in markets or the move in volatility? Markets that move suddenly will cause volatility indicators to increase. In that case, the moves in the market lead the indicator. There are times, however, when subtle changes in the volatility indicator suggest a potential change in the market’s direction.
What we’re looking for when looking at volatility is divergences. Meaning, if volatility is rising as the stock market is rising, that could suggest the bull market is running out of gas. Similarly, if volatility falls even as the stock market is in a bear market, that could suggest that a market bottom is near.
What Is the VIX Index and What Can it Tell Us?
The most popular way to measure volatility in the stock market is the Volatility Index published by the Chicago Board of Options Exchange; CBOE for short. The math behind this index is far beyond the scope of myself and this article, but basically it measures the daily range of the S&P 500 and how quickly the direction of the market changes day-to-day.
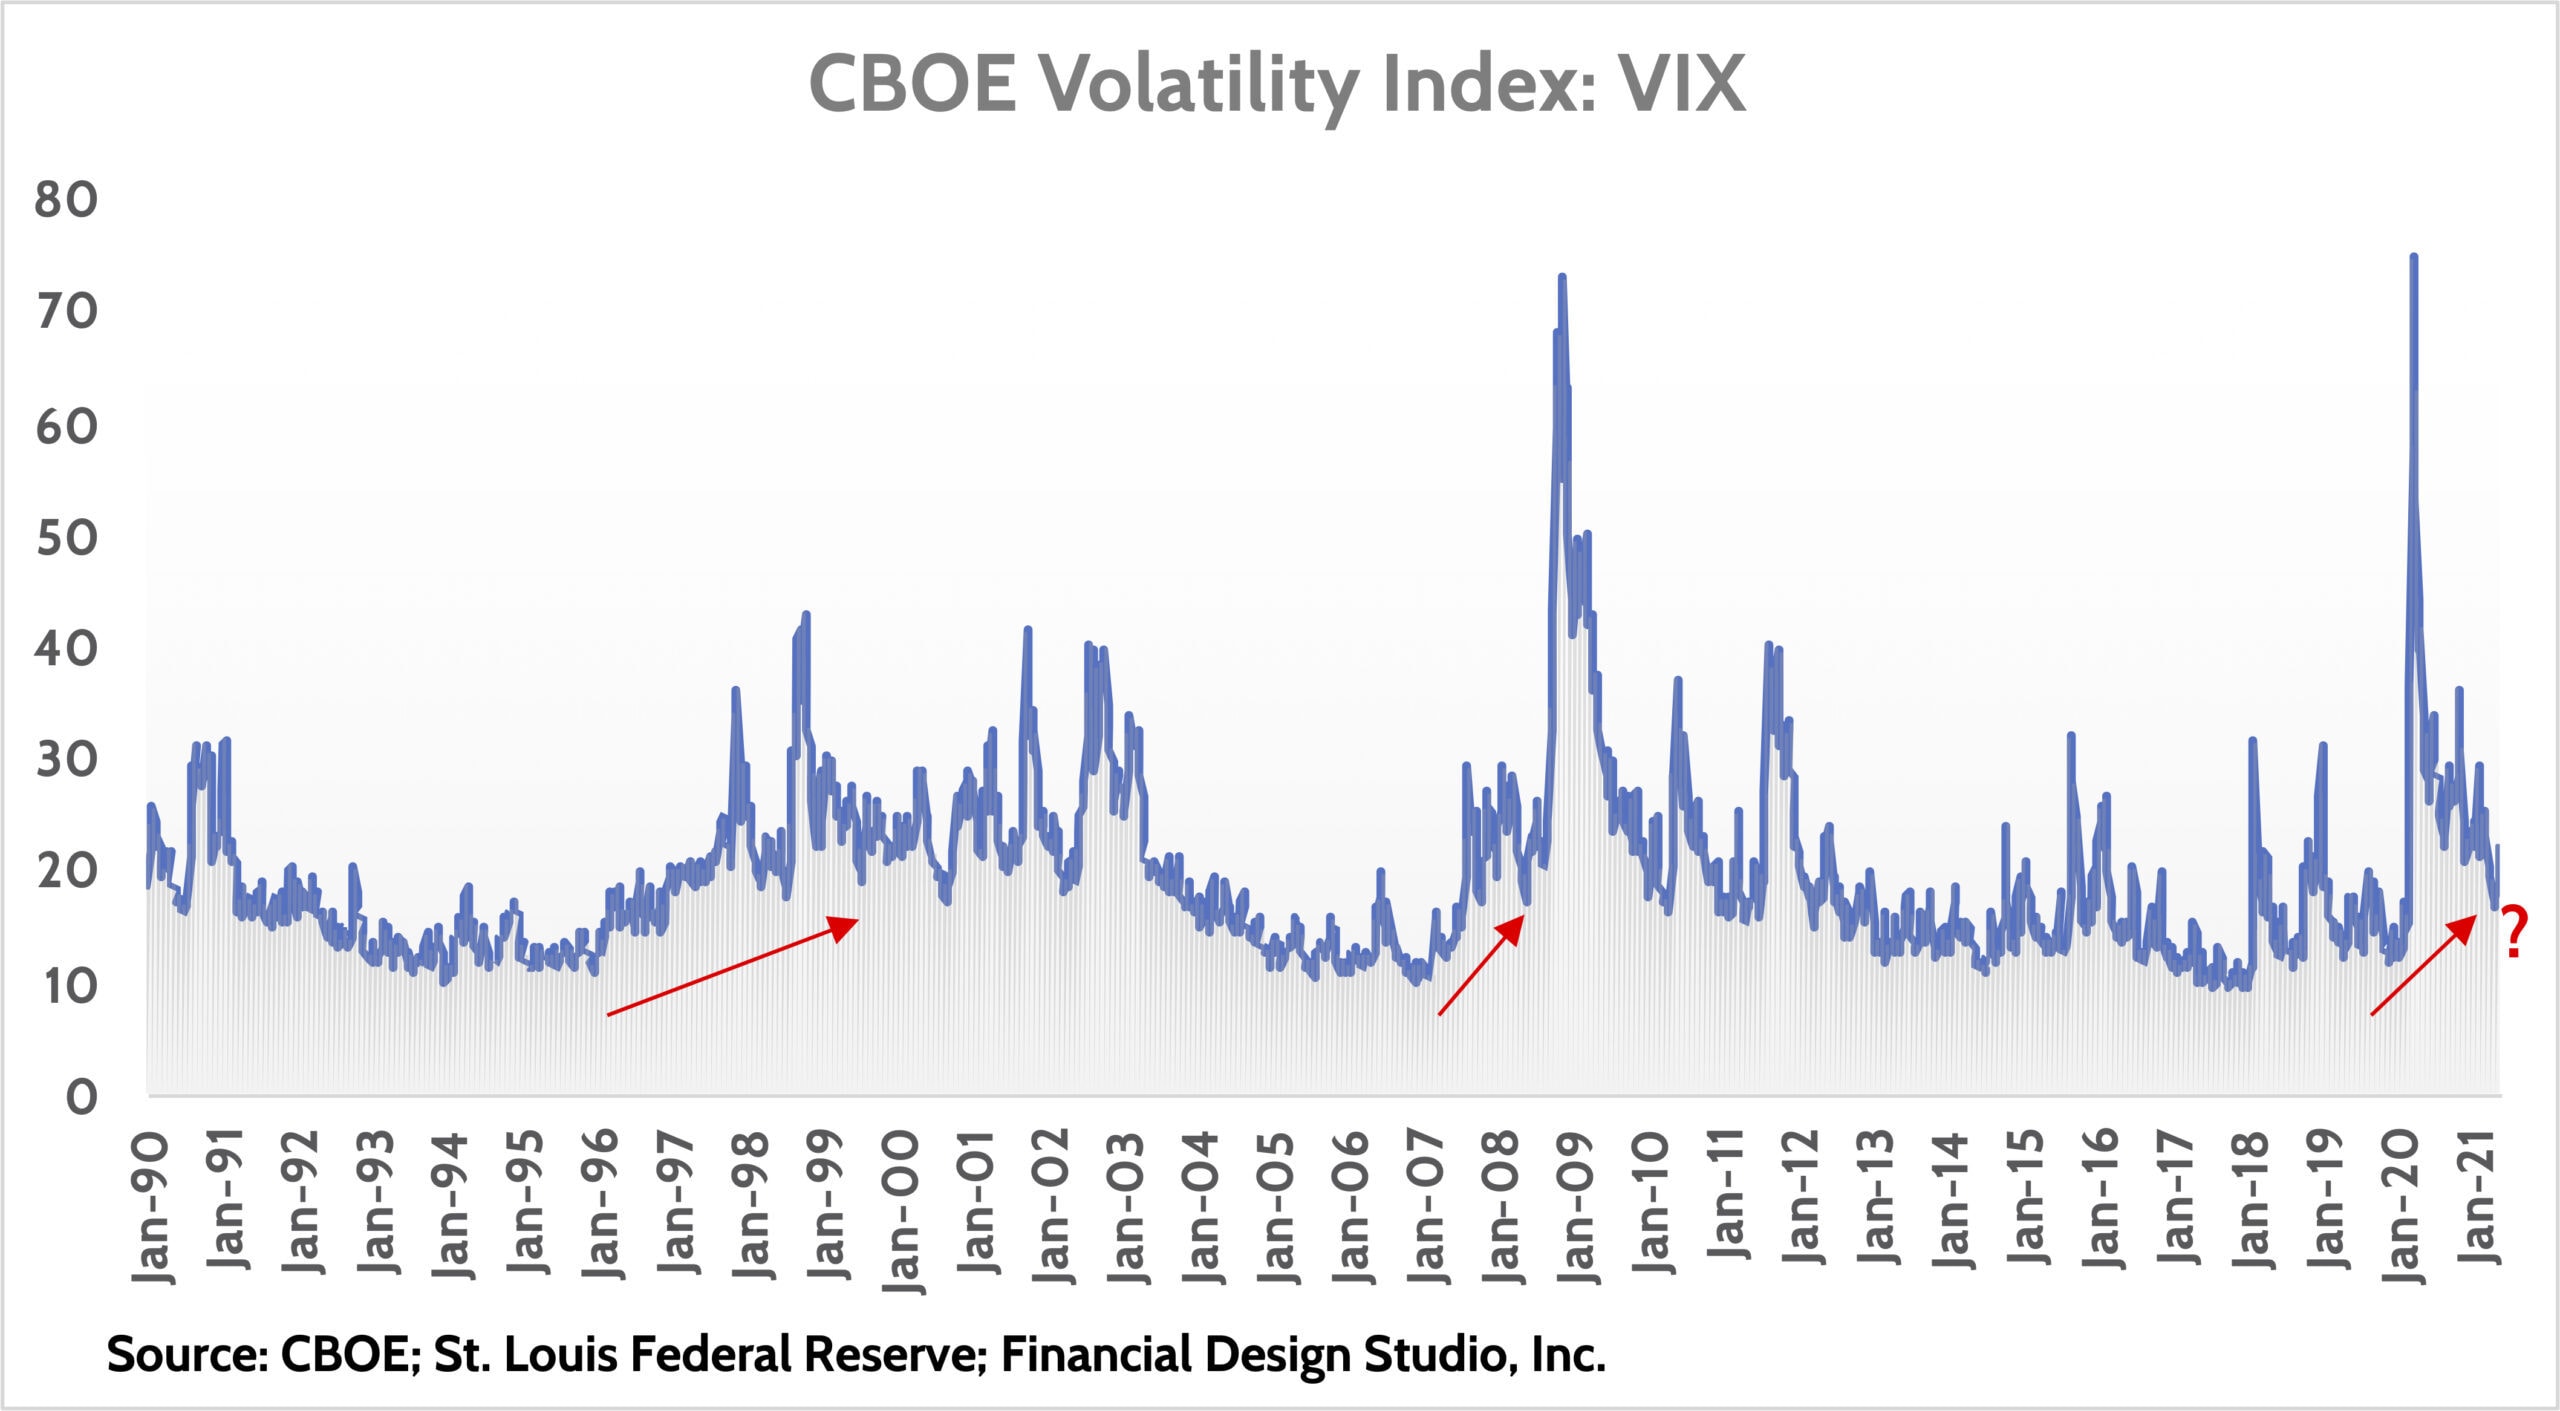
When I talked about “divergences” above, the red arrows are what I’m referring to. In the 1997-2000 period, the VIX was rising even as the stock market was surging to record highs on the back of the Dot-com bubble. Subsequently, the market fell -45% from 2001 to early 2003.
We saw a similar dynamic in 2007. The volatility measure increased from all-time low levels, even as the stock market continued to rise, peaking in September of that year. We all know what happened next: the housing bubble burst and stocks almost got cut in half.
In 2020, we experienced an enormous surge in volatility (and drop in stock market) as the COVID crisis erupted. Since then, stocks have fully recovered and have reached all-time highs.
What’s interesting to us is that the volatility index remains higher today than it was right before COVID hit, even with stocks much higher than their early 2020 peak. Only time will tell whether this means anything, but it’s an interesting divergence to watch.
Margin Debt: The Tool Investors Used to Goose Investment Returns
The other indicator we’ve been watching closely is investor margin debt. What is margin, you might ask? It’s debt that a broker will lend to you to buy stocks and bonds.
Financial leverage gives the investor/debtor the potential to make more on their cash than they would if they had to put 100% of their money down to buy something. It’s used all the time in real estate, or to buy a car.
Let’s think about housing. A homebuyer wants to buy a $200,000 home. Buyer A puts a down payment of 20% cash and gets a mortgage on the rest of the purchase price. Buyer B has lots of cash and buys the $200,000 home for cash. Five years later, the price of the home has risen by 10% to $220,000. Both Buyers look to sell to capture this gain.
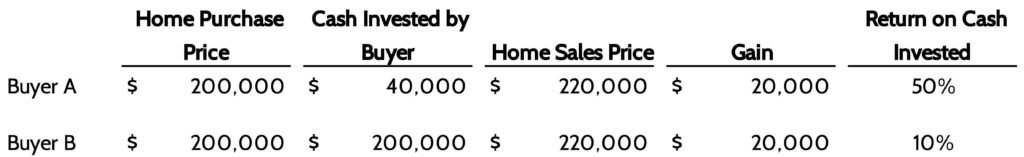
Both Buyers experienced the same $20,000 gain in the home’s price. But the cash-on-cash returns for each Buyer are different. Buyer A used leverage (i.e. a mortgage) to buy the home. She only put $40,000 of her own cash down but made $20,000 on the sale, giving her a 50% return on her cash invested. Buyer B avoided leverage and still made $20,000, but his return was only 10% as he put up the entire purchase price in cash.
The same logic for why we get mortgages when buying a home is why many investors use margin to buy investments: to increase our cash-on-cash returns. However, the risk of margin debt is far higher than that of a mortgage as the underlying asset – stocks and bonds – are much more volatile than the price of a house. Margin works great when prices are rising, but can quickly turn into painful losses when prices fall.
How has Margin Debt Increased in 2021?
We’ve seen an explosion in the usage of margin debt in recent years. It steadily rose as markets recovered from the 2008-2009 downturn. But since the lows of the COVID crisis in March 2020, margin debt has gone parabolic.
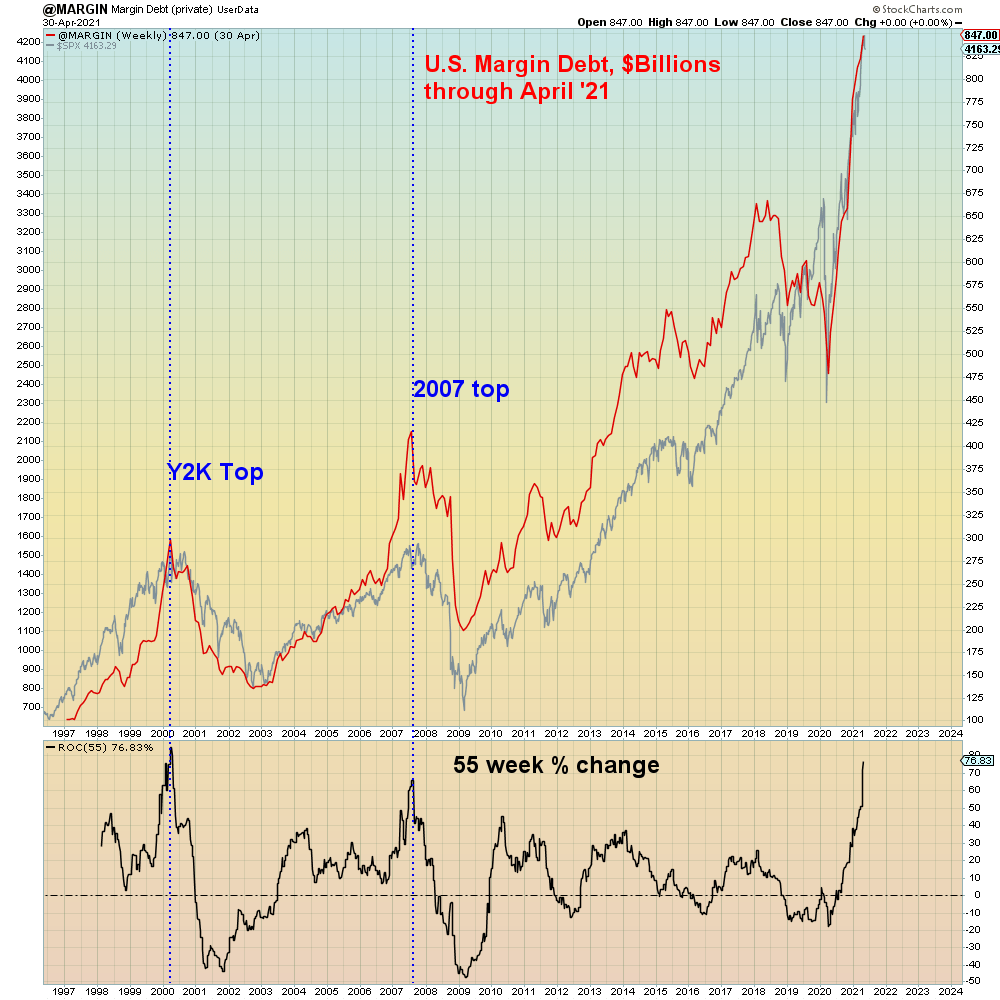
Look back to the top of the 2000 Tech Bubble (“Y2K Top”) and the top of the 2007 housing bubble. You’ll notice in both cases that margin debt (red line) exploded higher in the 12 months preceding the peak in the stock market. Similar to now, investors’ usage of margin debt went “parabolic.”
We are seeing the same thing play out right now. In fact, the 1-year change in margin debt is almost as high as what it was near the peak of the 2000 Tech Bubble. What’s curious about this is that we’re still in a very uncertain economic environment. While the COVID vaccine rollout appears to be putting an end to this uncertainty, it’s hard to argue we’re anywhere close to “normal” yet.
What are the Risks of Increasing Margin Debt?
Increasing margin debit reflects two dynamics. First, it reflects ever-increasing confidence by investors that stocks will continue to rise. No one wants to be leveraged if they expect prices to fall. So increasing margin debt is a clear sign of over-confidence by investors.
Second, banks and brokers are always there to facilitate this over-exuberance, even if they should know better. New players, such as Robinhood and other “new age” brokers, are giving out leverage like it’s candy. It’s not unlike the surge in the number of new mortgage companies offering no-income, no-asset mortgages (“NINAs”) back in 2005. Someone’s always willing to push the envelope.
Our view is that this increase in margin debt is a huge red flag for the market. Just like the 2000 tech bubble and mid-2000s housing market, individual investors are rushing into a hot market and using leverage to “goose” returns.
What’s remarkable to us is the sheer size of this increase in margin debt. Since the end of 2019, margin debt has increased by $300 billion to $850 billion. For reference, the total margin debt level at the top of the Tech Bubble was just short of $300 billion.
Conclusion: Prepare for More Volatile Markets!
Putting these two pieces together, our conclusion is that the market is at heightened risk of more volatility ahead. In fact, the current dominance of passive investment strategies may actually exacerbate future volatility. That’s a topic I’ll be covering in a future article.
As we saw at the outset, higher volatility usually means lower markets. Does that mean investors should sell everything and go to cash? No. Trying to time markets is a fool’s errand. Long-term financial goals, such as saving & investing for retirement, require investors to invest for the long-haul.
But that doesn’t mean we do nothing. We at FDS invest (no pun intended) a lot of time and energy to structure client portfolios to weather different markets, up and down. Even more, we invest resources to make sure we have systems in place to react to rapid changes in the market.
We put a lot of emphasis on this last item – investing in rebalancing and portfolio management systems. Increasingly, my view is that this is what’s going to separate the wheat from the chaff with financial advisors. Is your advisor able to react quickly to changing conditions?
If we are entering a structurally higher period of volatility – as I think we are – then now’s the best time to make sure you fully understand how your advisor is managing your hard-earned savings.
Ready to take the next step?
Schedule a quick call with our financial advisors.