Will Value Stocks Beat Growth Stocks in 2022?
by Rob Stoll, CFP®, CFA, Financial Advisor & Chief Investment Officer / January 6, 2022
On Wall Street, it’s always fun sport to take the first trading days of a New Year and muse about what they might mean for the rest of the year. Most of the time, early January trading doesn’t mean a lot. But as we are in the midst of several cross-currents hitting the economy and stock market, we shouldn’t avoid thinking about what signals are being sent by the stock market. One of the biggest questions on the minds of investors is, “Will Value Stocks Beat Growth Stocks in 2022?” We’ll look at this question and take a broader look at the makeup of the stock market as we head into the New Year.
What’s the Difference Between a Growth Stock and a Value Stock?
Companies go through life cycles, much as people do. When they’re young and just getting going, they’re growing. In the Chicagoland area, we can think of a company like Portillo’s. As locals, we’ve enjoyed their Italian Beefs for decades, but only recently have they expanded aggressively. They’re a “growth” company. Other examples of companies in their growth phase are Tesla, Facebook, and Netflix.
On the flip side, we can look at McDonald’s. They had their big growth phase from the 60s through the 90s, but have blanketed every corner with a restaurant. Now, they grow, but much more slowly. We’d call them a “value” stock. Other “value” stocks would be big banks like Chase, an oil company like Exxon Mobil, or an Industrial company like Honeywell. They’re older and steadier.
If we were to generalize each type of stock, we’d say that growth stocks are given a higher valuation multiple than value stocks. What I mean by that is for every $1 of profit or sales, a Growth company would be worth more than a “value” stock earning the same amount of money. You’ll pay more for growth today, thinking you’ll get more profit in the future.
What’s the Historical Performance of Growth vs. Value Stocks?
Investors go through cycles of preferring one type of stock over the other. While many of us follow a big index like the S&P 500, there’s actually a lot going on underneath the surface. Namely, a never-ending battle between growth stocks and value stocks.
These cycles between value and growth can last a long time and create massive out-performance of one versus the other. Let’s look at what’s happened the last 28 years. If the line’s moving higher, that means Growth stocks are beating Value Stocks. If the line is going down, Value stocks are beating Growth stocks.
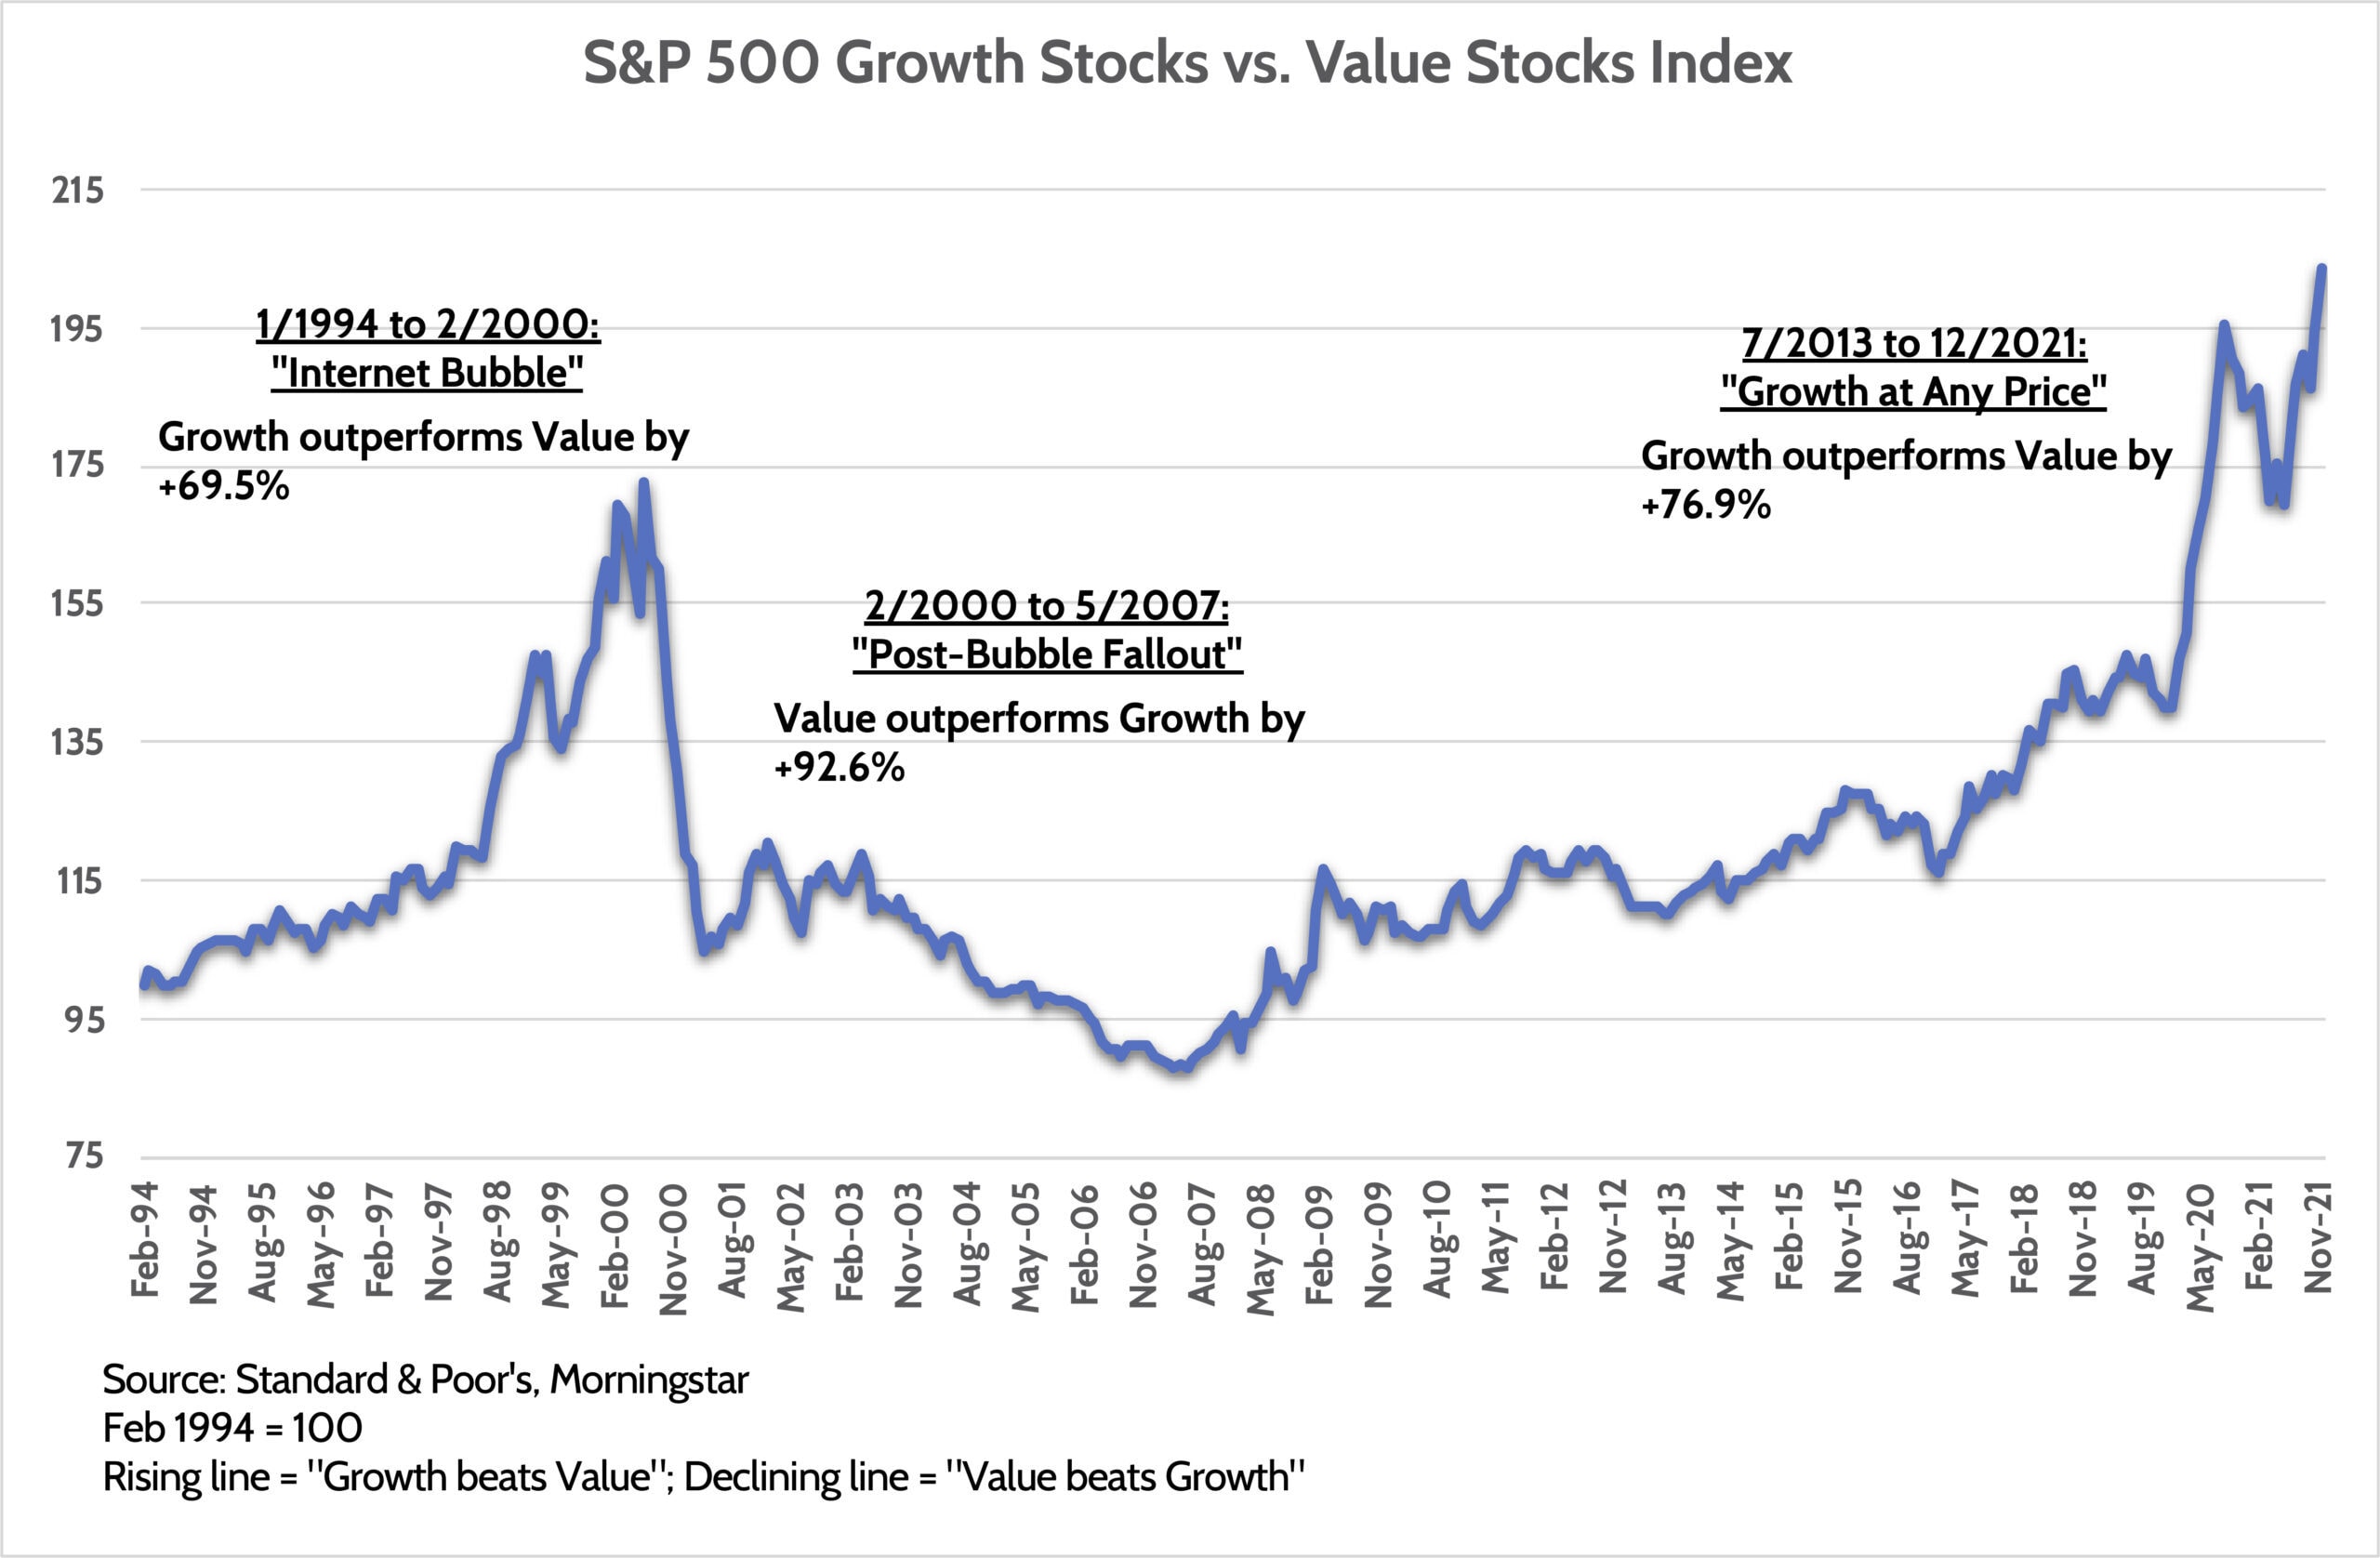
We can see three distinct cycles in the last 30 years. The first lasted from the mid-90s to early 2000. This was the advent of the Internet – the “New Economy” – if you’re old enough to remember. Growth companies such as Intel, AOL, and others powered the market higher, leaving “old economy” stocks like banks in the dust. All told, Growth outperformed value by almost 70%.
After the peak of the Tech Bubble in early 2000, the script flipped 180 degrees. Suddenly, people realized they were paying way too much for stocks that didn’t have the growth they hoped for. The verdict was swift. Growth stocks lost most of their 1990s gains in the matter of one year and continued to underperform until mid-2007. During this time, Value stocks beat growth stocks by a whopping 93%.
The Great Recession of 2008-2009 was particularly harmful to Value stocks, which were dominated by big banks that were getting bailed out by the government. Then, things stabilized for a few years. But in mid-2013, the Federal Reserve capitulated on its threat to tighten monetary policy, getting frightened by a modest hiccup in stock and bond markets. That proved a turning point for growth. From mid-2013 through December 2021, Growth stocks have annihilated Value stocks, outperforming by 77% that time.
Can Tech Stocks Continue to Dominate the Stock Market?
As Growth has surged in recent years, voices calling for a turn towards Value stocks have grown louder. You can put me in this camp as well. “These growth stocks can’t possibly keep going up forever!”
I will refrain from making another (wrong) prediction about a turn in the stock market’s leadership. But it’s worth going behind the numbers to appreciate how much the structure of the market has changed in the last decade.
The most striking change I’ve seen in the last decade is the composition of the S&P 500 Index by sector. Having spent my entire 24 year career in the “market,” I’ve had the privilege of seeing sectors move in and out of favor with investors.
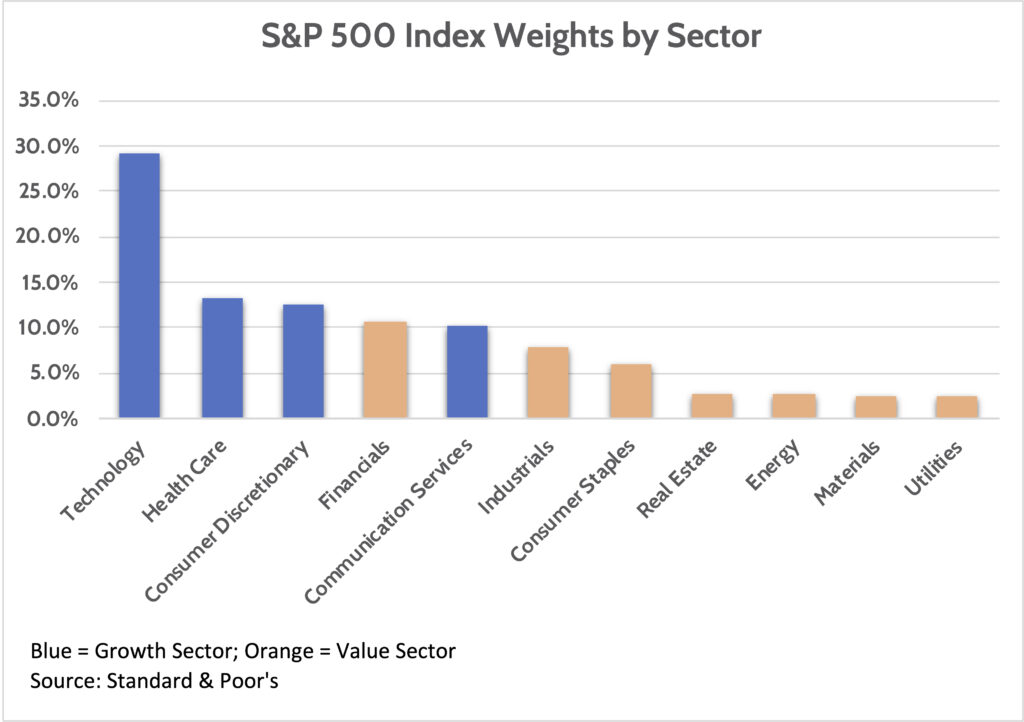
As you might imagine with Growth dominating in recent years, Technology stocks make up the largest part of the market, close to 30% of the entire value of the index. In fact, Growth stocks dominate the index. The chart below is color coded to show you Growth sectors (blue) and Value sectors (orange.)
This isn’t the first time Technology has been this large. Coincidentally, it reached almost the same weight – 29.2% – at the end of 1999, the peak of the Tech Bubble. Just two years later, the sector accounted for just 14% of the S&P 500 index, an epic collapse in such a short time.
Throughout history, other sectors have gone through similar cycles. The cycle most dear to my heart was seeing the Financial Sector go from a 13% weight in 1999 to 23% weight before the 2008 Housing crisis. At the stock market’s nadir in March 2009, Financials accounted for just 9% of the index weight!
Point is, the sector “working” today isn’t necessarily the sector that’s going to work tomorrow. Especially when it dominates the market, as appears to be happening today.
Is Value Being Undervalued?
Looking at the above chart again, we see a lot of Value sectors clustered on the right-hand side. Real Estate, Energy, Materials, and Utilities. I’d also throw Industrials into this mix. Investors give all these “old economy” sectors little value, yet they’re very important parts of our everyday lives. Just look at your natural gas heating bill for December, if you don’t believe me.
The most striking example I see today is Energy stocks. Despite all the noise about getting to “net zero” emissions, oil & gas is just as important to the economy as it has ever been. Many investors have been dumping these stocks to create “green” portfolios. All of which has driven the Energy sector weight to a 3 decade low.
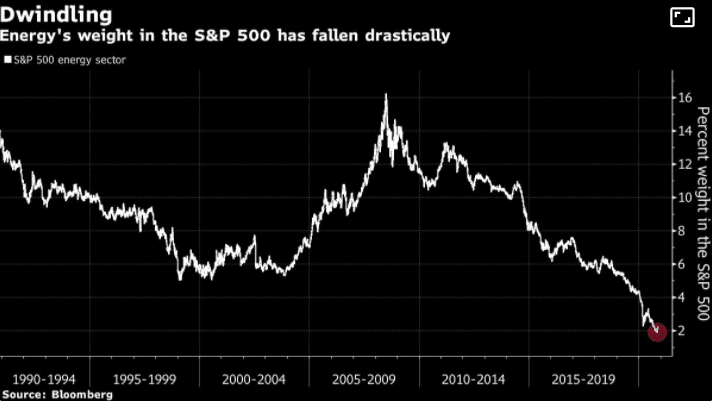
Since the Energy sector is volatile and driven by oil prices, its weight in the S&P has been all over the place. But this is easily the lowest it’s ever been. In a world that remains starved for energy, are we to believe the value of this entire sector is just 2.5% of the stock market?
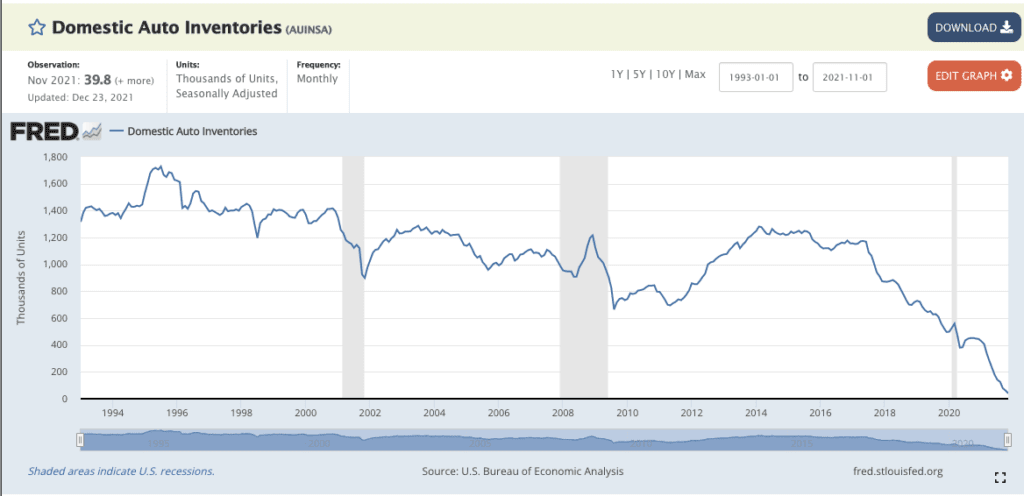
Another example. We’ve all heard about supply chain disruptions and shortages of everything from sneakers to toys. But did you know that current auto inventories are 94% below normal as car manufacturers haven’t been able to get parts to build them? What’s going to happen to those “old” stocks – the Fords and General Motors of the world – when people realize that production needs to be ‘pedal to the metal’ for years to compensate for these inventory issues?
And finally, I’ll circle back to my old friend, the Financial Sector. This sector has been uninvestable for almost 15 years. First collapsing with the housing crash. Then suffering from the Federal Reserve’s zero interest rate policy. But now, the Fed is clearly signaling higher rates and yet the Financial sector is at one of its lowest weights in the last 30 years.
As these small-ish, “old economy” value sectors see fundamental business prospects improve, it’s just a matter of time until they catch the attention of Tech investors.
How FDS Manages Sector Concentration Risk
As part of our investment process, we don’t make market-timing “calls” on which stocks or sectors are going to do better or worse from year-to-year. It’s impossible to be consistently right on those calls. So we focus on different types of stocks and bonds – “asset classes,” we call them – and make sure we’re well-diversified by investing a portion of client money in each of those asset classes.
What we don’t do is blindly buy passive index funds in each of those asset classes. Yes, we own these in client portfolios. But we first ask, “is this fund adequately diversified within the asset class we’re trying to target?” Sometimes, the answer is “no.”
A good example of this is the S&P 500 Index we’ve been talking about in this piece. This is a Large Cap U.S. stock index that is often one of the biggest – if not the biggest – asset class in any investor’s portfolio.
You’ve seen that Technology stocks make up nearly 30% of the index. Historically, that’s about as high as any sector weight has been. Even worse, the top 5 stocks in the S&P 500 make up nearly 25% of the index. So if you put $100 into an S&P 500 index fund, you’re getting $25 of Amazon, Apple, Google, Tesla, and Microsoft and $75 of the other 495 companies.
I mentioned earlier that Tech made up almost 30% of the S&P 500 Index in 1999, only to lose half its weight in two years. How did that impact the passive S&P 500 index fund investor?
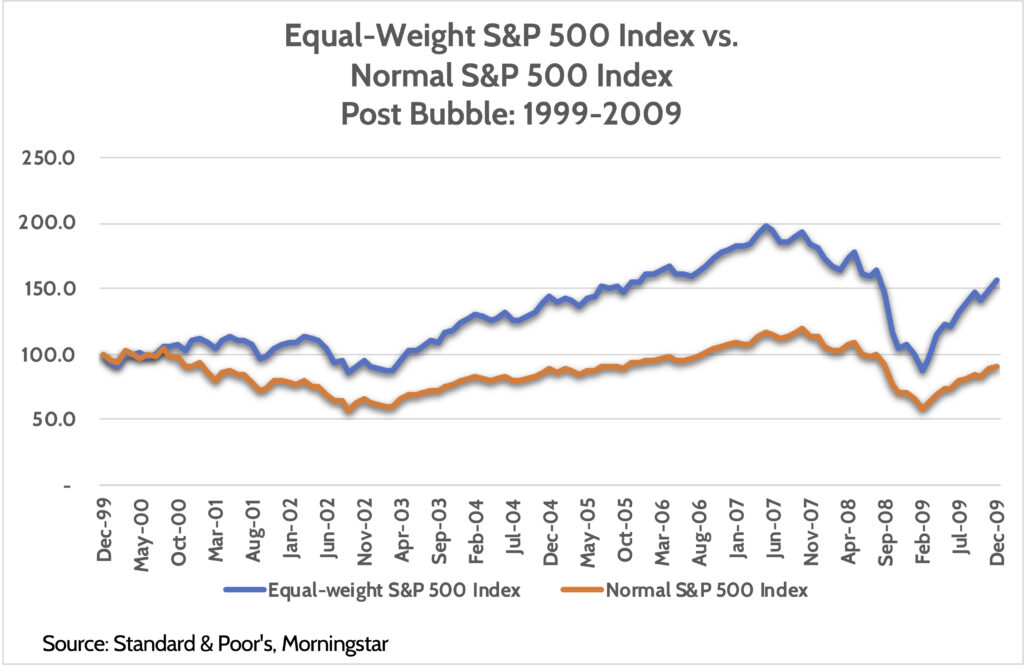
An investor who stuck $100 in a run-of-the-mill S&P 500 Index fund at the end of 1999 ended up with a fund worth $90 ten years later. Think about that. They made no money for a decade in one of the most important asset classes in their portfolio.
If, however, this same investor was paying attention and saw how concentrated the market had gotten in 1999, they could’ve bought an equal-weighted S&P 500 Index fund and ended up with over $150 ten years later.
Why did this performance divergence happen? Because there was an important turn in investor preference away from Growth stocks and towards Value stocks in early 2000. Suddenly, owning Old Economy was the cool thing to do!
How FDS Helps Manage Your Investments
This is just one example of how FDS pays close attention to how we manage client investments. We take the same, thoughtful approach with each asset class and every investment we choose for client portfolios.
Investors have been blessed with a huge run higher in stocks over the last several years. This is allowing many near-retirees to pull-forward their retirement date by a year or two. To get out of the rat race.
We at FDS can help you transition to this new phase of life and make sure you don’t unnecessarily give back gains from recent years. Let us do a deep-dive analysis of your current investment portfolio to make sure you’re not overly concentrated in sectors or stocks that might not be tomorrow’s leaders.
Ready to take the next step?
Schedule a quick call with our financial advisors.