The Nifty Fifty
by Financial Design Studio, Inc. / August 20, 2020

Big tech companies reported earnings the last week of July, handily beating analyst expectations. This sent their stocks soaring, with Apple, Amazon and Facebook surging to record highs. It’s been an incredible run for the stock prices in America’s biggest companies. So much so that the top 5 stocks in the S&P 500 Large Cap index make up 23% of the overall index, which is the highest percentage since the 1972 Nifty Fifty Era.
The concentration of the stock market harkens back to the Nifty Fifty Era of the late 60’s and early 70’s. Back then, it was names like Disney, IBM, McDonalds, and Xerox that were the heroes. Today it’s Apple, Microsoft, Amazon, Facebook, and Google. The question is: does it mean anything to see markets this concentrated? While no two periods are the same, it’s a good time to dust off the history books on the Nifty Fifty to see how that played out.
Why did Warren Buffett “Retire” in 1969?
In 1957, 27 year-old Warren Buffett launched Buffett Partnership Limited (BPL). Having been a student of Benjamin Graham – the father of fundamental investing – Buffett took what he learned about investing and decided to start his own fund.
And what a start it was. From 1957 to 1968, BPL generated investment returns in excess of 25% per year compared to annual returns in the Dow Jones Industrial Average of 9%. Despite the success, Buffett started turning cautious on the market in 1967. In his May 1968 partnership letter, he wrote, “We live in an investment world, populated not by those who must be logically persuaded to believe, but by the hopeful, credulous and greedy, grasping for an excuse to believe.”
Suddenly, in May 1969 at the tender age of 38, Buffett announced that he was closing down BPL and would retire. By the end of the year the partnership was closed. Interestingly, his last investment recommendation was for his investors to buy tax-exempt bonds, which were yielding 7% at the time.
“I am not attuned to this market environment and I don’t want to spoil a decent record by trying to play a game I don’t understand just so I can go out a hero.” -Warren Buffett, May 1969 Partnership Letter
We know that Buffett continued his investment career running Berkshire Hathaway, which he still does to this day. But it happened after the Nifty Fifty Era that drove him out of the market blew up, creating once-in-a-lifetime investment opportunities for him to invest in again.
Buffett took a similar stand against the market mania in 1998 and 1999 during the Tech Bubble. That market was also concentrated. This time around, he didn’t retire. But he refused to buy high-flying tech stocks. He caught a lot of flak for that stance at the time but ended up performing extremely well after the bubble eventually burst.
What’s Buffett Doing in 2020?
We’re witnessing another concentrated market and another moment when Buffett isn’t following the herd. In the midst of the market panic we experienced this past March – when the S&P 500 dropped over 30% from its peak – Buffett was a net SELLER of stocks, not a buyer. This, despite the fact Berkshire has $137 billion of cash sitting on the sidelines!
“I will not abandon a previous approach whose logic I understand even though it may mean foregoing large and apparently easy, profits to embrace an approach which I don’t fully understand, have not practiced successfully and which, possibly, could lead to substantial permanent loss of capital.” Warren Buffett, 1967
History of Stock Market Concentration
Economist Jim Bianco of Bianco Research posted an interesting chart a few weeks ago looking at the concentration of the top 5 stocks in the S&P 500 going back 50 years.
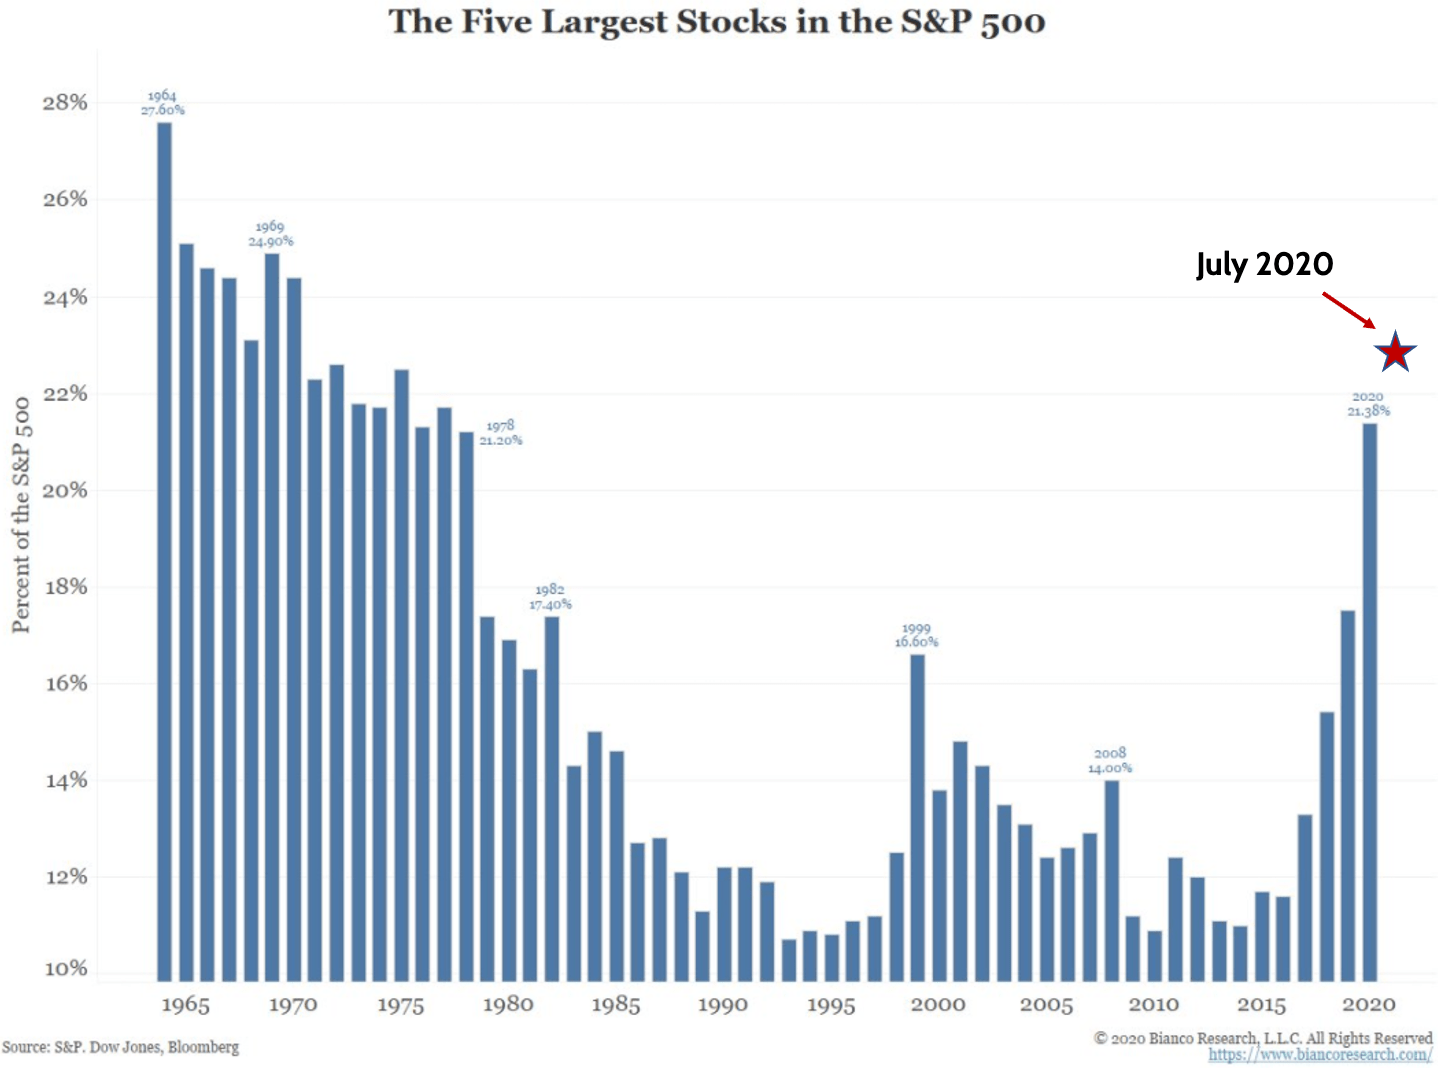
After a 40-year period when the top 5 stocks in the S&P 500 averaged a combined weight of around 13%, concentration has surged. You can see that as of July (red star), just five stocks make up 23% of the index.
Buffett noted in his letters in the late 60’s that the number of attractive investment opportunities was rapidly diminishing. As that happens, investors invariably pile into the “winners,” regardless of price.
We believe the current market concentration is a yellow “caution” flag for investors. Mr. Market is telling us that the investment opportunity set is becoming narrow. Everyone’s money is going into the same, small group of perceived winners, just like the Nifty Fifty Era.
Valuation Extreme of the Nifty Fifty Era
Nifty Fifty stocks reached their peak in the early 70’s, around the time that Led Zeppelin released their fourth album, Led Zeppelin IV. Valuations for these stocks, as measured by their price/earnings ratio (P/E), surged to extremely high levels in 1972.
To help you understand how high these P/Es got, understand that the average price/earnings ratio for the S&P 500 over the last 25 years is 16.0x. If a run-of-the-mill good company trades at a mid-teens P/E, a “growth stock” might normally at 20.0-30.0x their earnings.
Below, you can see that some of the biggest companies were trading at upwards of 60-80x P/Es. Any way you slice it, these stocks were very expensive!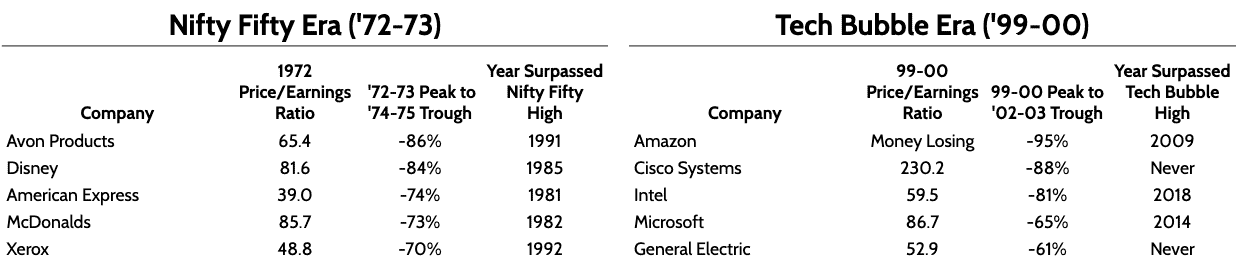
It’s always a mystery as to what pops a bubble, but you can see that once it does, it can get ugly for these big, popular companies. And it can take a long time for these stocks to regain the all-time highs they achieved in their respective bubbles.
One key investment lesson to learn from this table above is this: “Great companies can have long periods where they’re terrible stocks.” Other than Avon, General Electric, and Xerox, all of the companies above are alive, well, and thriving. They grow and dominate in their respective markets.
But that doesn’t mean their stocks go up in a straight line. Amazon, Cisco, Intel and Microsoft continued to grow even after the Tech Bubble burst. But it still took 10-15 years for their stocks to fully recover. The same dynamic was seen with the Nifty Fifty (Amex, Disney, and McDonalds.)
Of course, long-term investors like Warren Buffett would’ve been handsomely rewarded for holding these stocks through thick-and-thin. But given the nature of retirement time horizons, not everyone can take the attitude of “I’ll just hold this stock forever.” At some point, you’re gonna need that money.
Diversify Portfolio with Small Cap Stocks
How should investors navigate these kinds of markets? We believe the key differentiator between successful and unsuccessful investors in times like these is maintaining discipline. Buffett quit in 1969 because the potential cost of abandoning his discipline was too high. Put another way, he didn’t chase the fad just because it looked like easy money. And he was eventually proven right.
One of the key strategies that we employ at FDS is maintaining well-diversified portfolios. That means you own stocks in large companies, small companies, international companies, and emerging market companies. On the bond side that means owning safe U.S. Treasuries and higher-yielding bonds.
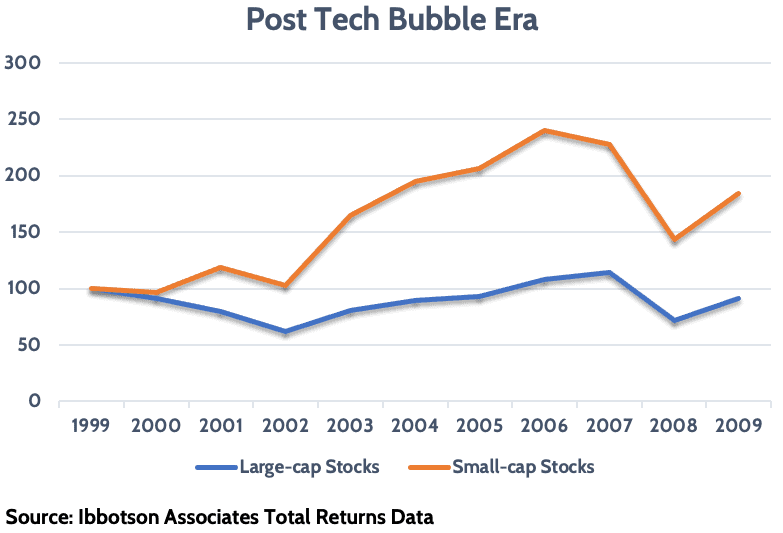
What catches my eye the most from looking at the post-Nifty Fifty/Tech Bubble periods is that small stocks tended to do well after the big guys eventually blew up. The Davids stood up to Goliaths.
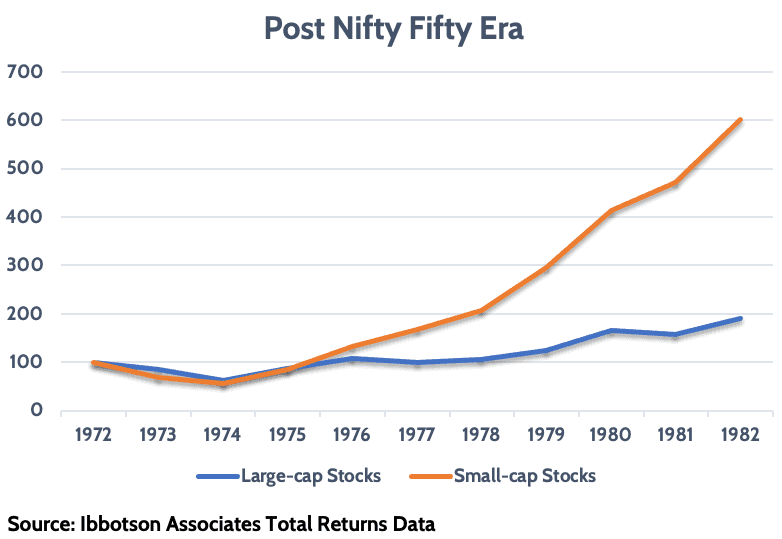
This dynamic was pronounced in both periods. After the Nifty Fifty blew up, large stocks generated gains of 6.7% per year over the next 10 years, while small stocks gained an average of 19.7%.
After the Tech Bubble burst, large-cap stocks actually LOST money over the next 10 years, losing an average of 0.9% per year. Meanwhile, small-cap stocks posted respectable gains of 6.3% over the same period.
If an investor had gone “all-in” on these Goliaths at the wrong time, they were setting themselves up for years of disappointment. Remember, the money you’re stashing away will eventually be needed in retirement. So having a bad 10 years can make quite a difference in the kind of retirement you enjoy.
A diversified investor, by contrast, did better. Sure, they still had some of their money in lagging large-cap stocks. But because they were diversified, they also had money in small-cap stocks, which did better.
Why Having Investment Diversification Makes Sense
Maintaining the discipline to stay diversified when one part of the market goes up like crazy can get the best of us. “If only I had put all my money in Apple, then I’d be retiring in Tahiti!”
But Mr. Market has shown us time and time again that what’s popular today doesn’t stay popular forever. Things change. And stocks in great companies can go through long periods of terrible performance.
That doesn’t mean you should get out of the market and invest in muni bonds like Buffett did 51 years ago. With rates near 0%, that can turn into a costly exercise. It simply means that diversification will work to your benefit over time if you stay patient with it.
We always advise clients to remain focused on their time horizon when investing. Unless you’re planning on living off of Social Security alone, there’s going to be a day when you’ll be drawing down your investments so you can buy food, pay taxes, and fund your medical expenses. Staying disciplined and diversified with your investments not only makes sense financially, but also reduces stress and uncertainty as you get closer to your goal.
Ready to take the next step?
Schedule a quick call with our financial advisors.