Fewer Eggs In The Basket
by Financial Design Studio, Inc. / July 9, 2020

One of the key investment themes we’ve seen in 2020 has been the rise of “winner-take-all” stocks. These are the stocks of the biggest companies in the U.S. And they’ve gone up a lot this year and left the rest of the market in the dust. This has increased the concentration of stock market performance.
What’s Driving the S&P 500 to Record Highs?
Newspaper headlines are notorious for only telling part of the story. Recent headlines have crowed about the fact that the S&P 500 Index is barely down in 2020 despite huge economic disruption from COVID-19. But these headlines gloss over the real story that’s taking place.
A chart recently came across our desk showing how the 10 largest companies in the S&P 500 index have fared against the rest of the index. Focus your attention on the first column (Company Size) and the last one (YTD Returns).
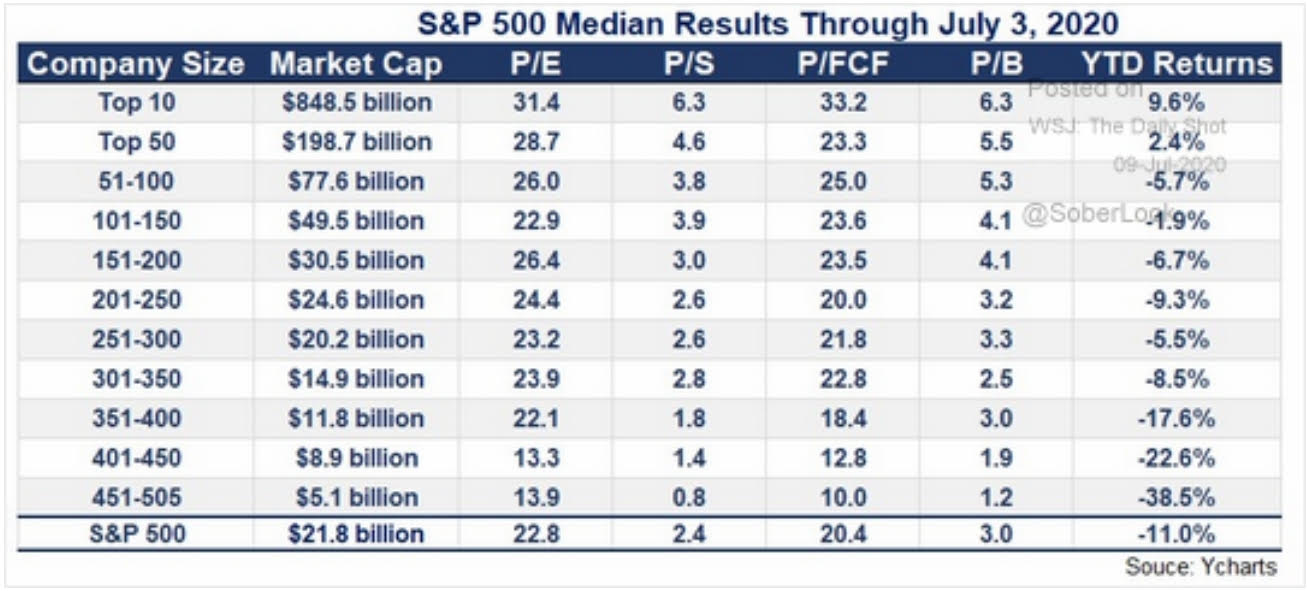
What you see here is that the 10 largest stocks in the S&P 500 are collectively up 9.6% in 2020.
But as you scroll down the chart you see the returns for each bucket of “smaller” stocks gets worse and worse. It’s almost hard to believe the smallest 100 stocks in this index of 500 stocks are down close to 30% year-to-date, on average.
The way the S&P 500 Index is calculated gives bigger companies bigger “weights.” The bigger they are, the more representation they have in the index. For example, Microsoft, Apple, and Amazon are the three biggest companies in the world. Microsoft and Apple make up 6% of the S&P 500 Index while Amazon makes up 5%, for a total of 17% between the three of them.
Amazon is up 70% in 2020 while Microsoft and Apple are each up 30%. You can see why the Top 10 stocks in the chart above have done so well versus the rest of the market!
We can also look at this dynamic by comparing the S&P 500 Index to an exchange-traded fund that holds all the stocks in the S&P 500 but weighs each of those stocks equally. Meaning, no matter the size of the company, the fund holds exactly 0.20% of the fund in each of the 500 stocks (500 stocks x 0.20% each = 100%).
This is called an “equally-weighted” index.

The S&P 500 Index, represented by the blue line above, is only down 1.5% in 2020. Remember that Microsoft, Apple, and Amazon make up 17% of that index and have risen a lot this year.
Conversely, the equal-weighted fund of the same S&P 500 Index – the red line above – is DOWN 12% in 2020. That’s highly unusual. Since this equally-weighted fund was launched in 2003, it has almost always beaten the regular S&P 500 index. Not so in 2020, or the last 3 years for that matter.
Is Market Concentration a Bad Sign?
First, the market is increasingly being driven higher by a smaller and smaller pool of stocks. If you haven’t owned a lot of Microsoft, Apple, and Amazon this year, you’ve not done well.
Secondly, this concentration in market performance tells us that the real economy is much weaker than the stock market would suggest. If the economy was strong, that’s good for all companies regardless of size. A rising tide lifts all boats.
By piling into a smaller and smaller pool of “safe haven” stocks, investors are essentially saying they’re losing confidence in the prospects for the other 490 stocks in the index. Sure, no one is going to get rid of their iPhone or stop using Amazon all of a sudden. But those other 490 companies are important to our daily lives – banks, energy companies, building materials, dishwashers, etc.
What would cause a reversal in this trend is anyone’s guess. But the fact it’s happening should raise investor antennas.
Ready to take the next step?
Schedule a quick call with our financial advisors.


Recommended Reading


How Will AI Affect the Jobs Market?
White collar workers are wondering how AI will affect the jobs market, and their career. This article shares what's noise and what's real.

Financial Design Studio, Inc.
We are financial advisors in Deer Park and Barrington, IL. A team with a passion for helping others design a path to financial success — whatever success means for you. Each of our unique insights fit together to create broad expertise, complete roadmaps, and creative solutions. We have seen the power of having a financial plan, and adjusting that plan to life. The result? Freedom from worrying about the future so you can enjoy today.