Are the Bulls Back in Control of the Stock Market?
by Rob Stoll, CFP®, CFA, Financial Advisor & Chief Investment Officer / July 19, 2023
There’s been a remarkable turnaround in market sentiment since the start of 2023. Memories of 2022’s terrible performance – which saw both stocks and bonds post double-digit losses – have faded quickly and it appears the bulls are back in control of the stock market. Is this the start of a new, sustained bullish stock market?
More important to our clients, what does this market performance mean for conservatively managed portfolios? What happened to our call that the economy would head into a recession? We’ll tackle these questions and our outlook for the second half of 2023.
Market Returns Have Been Strong in First Half 2023
The last seven years have been remarkable for investors. It’s truly been a “feast or famine” investment environment. 2018 and 2022 were years when no asset class did well. 2017, 2019, and 2020 were years where “everything worked.” Only 2021 saw some combination of asset classes up or down.
The first half of 2023 has proven to be another “everything working” year. Of the 12 asset classes we actively track, all of them are up in 2023. There is one asset class not included in the chart below that has bucked the trend the last two years, which is an important part of client portfolios: Commodities. Amid a terrible year for stocks and bonds in 2022, commodities were up over 25%. This year, they are the one asset class that hasn’t done well, down -7.5%.
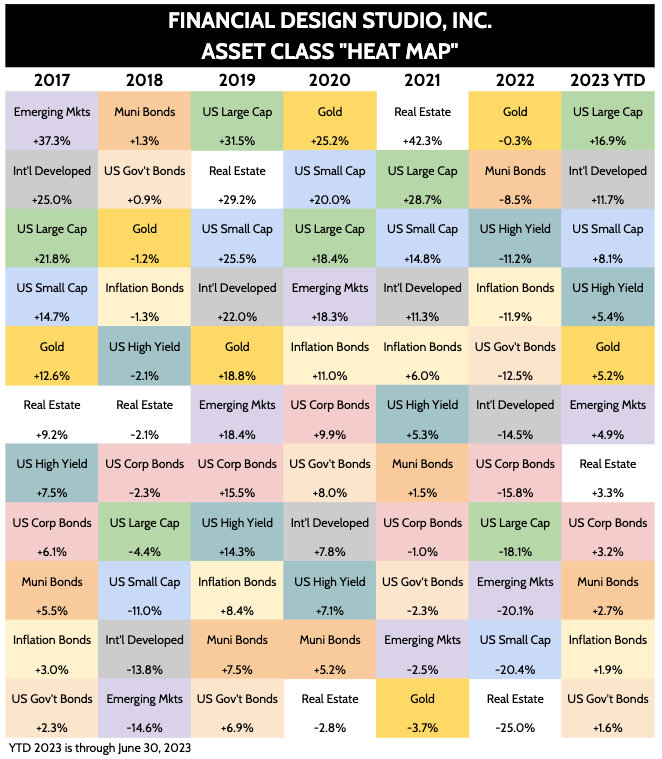
Despite all asset classes being in positive territory for 2023, it’s notable how muted many of the rebounds are in contrast to 2022’s poor performance. For example, US Government bonds were down a historic -12.5% in 2022. So far in 2023, they’re up only +1.6%. Small company stocks were down -20% in 2022 but have only risen +8% in 2023.
Stock Market Performance Has been Narrow
Heading into the second half of 2023 one of the biggest questions is whether the stock market’s rally will broaden out. Just seven large cap growth stocks – Apple, Microsoft, Google, NVIDIA, Amazon, Tesla, and Meta – have accounted for over 80% of the S&P 500 index’s first half return. We call these the “Fantastic 7” in the table below.
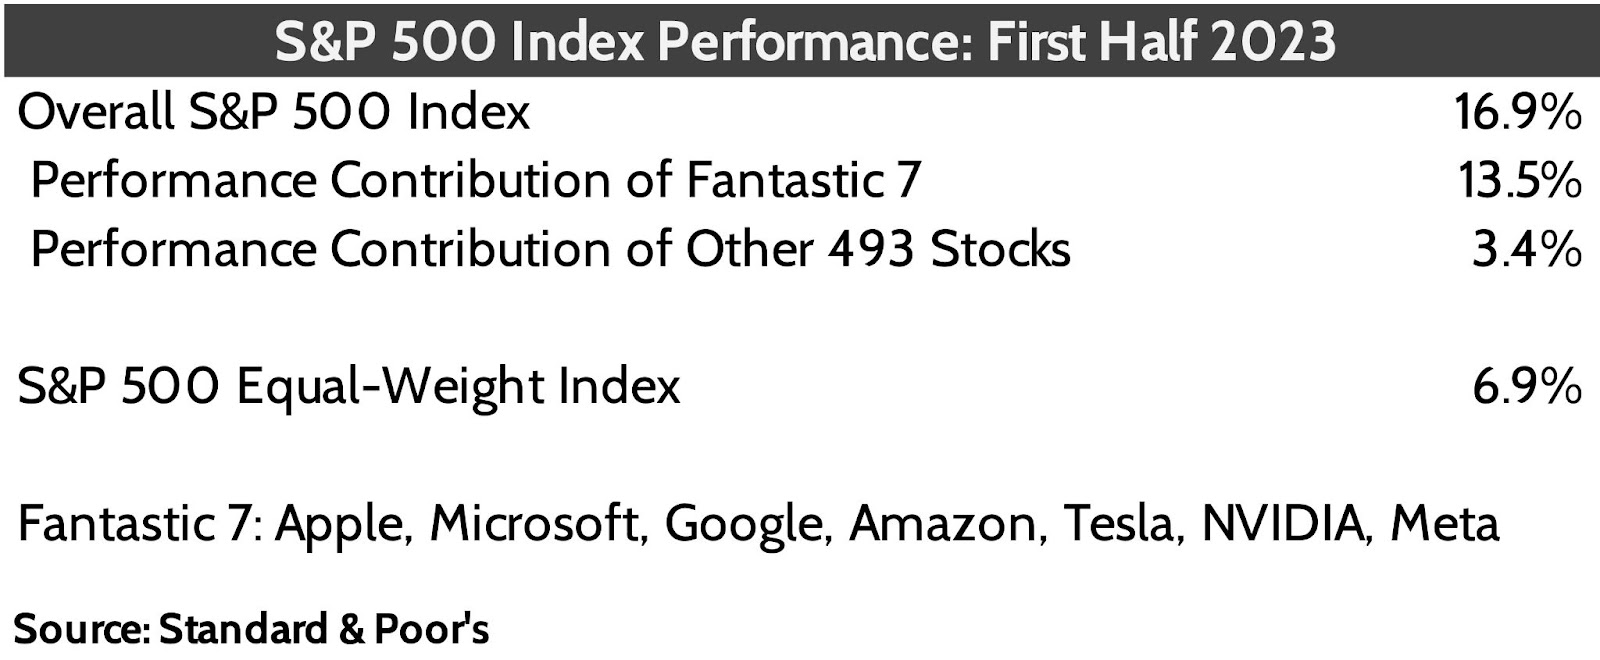
This performance concentration isn’t normal. Studies show that in any year, the top 10 stocks in the S&P 500 drive about 30% of the index’s performance for the year. This year it’s over 80% of the index’s return.
There are other interesting indicators of the market’s concentration in the largest companies:
- Apple represents 7.8% of the S&P 500 index, the largest single company weight since IBM in 1970.
- The top 5 stocks in the S&P 500 make up 24.3% of the index. The only time since 1970 the top 5 stocks represented that large of a weight in the index was at the end of 2021 when they made up 25.6%.
Market Concentration Danger
In mid-2021, we became concerned about the market’s concentration in this handful of stocks. We switched clients from an S&P 500 index fund where each company’s weight is determined by its market value to an Equal-weight S&P 500 index, which weighs each of the 500 stocks equally.
This switch worked out well in 2022, as the equal-weight fund outperformed the regular S&P 500 index by 6.5%. And until the failure of Silicon Valley Bank in early March 2023, the equal-weight and regular S&P 500 index were neck-in-neck performance-wise for 2023.
That bank failure and others that followed triggered a flight-to-quality away from economically sensitive sectors like banks and energy towards the Fantastic 7. From SVB’s failure through June 30, the regular S&P 500 index has outperformed the equal-weight index by a whopping 9.7%.
This has been a big reason client portfolios have lagged benchmark indexes. The question is, what do we do from here?
The Big Question for 2023 Investors: Will the Rally Broaden?
Many commentators are writing off the rally in the Fantastic 7 as being excessive. They say it’s unsustainable and the stocks are poised to come down to earth. Maybe.
The fact of the matter is that estimated profits for companies like NVIDIA are 130% higher than the start of 2023. Meta’s estimated profits are +76%, Google’s are +13%, while Microsoft and Apple’s estimates are up less than 5%. So we cannot completely dismiss the rally in these names as unwarranted. At a minimum, these stocks may “hang out” at these high levels, waiting to see if the brighter earnings prospects actually pan out or not.
So that leaves the rest of the market. Banks, energy companies, telecom companies, utilities, consumer staples. These sectors of the market got beaten up this year as recession fears took hold after the bank failures.
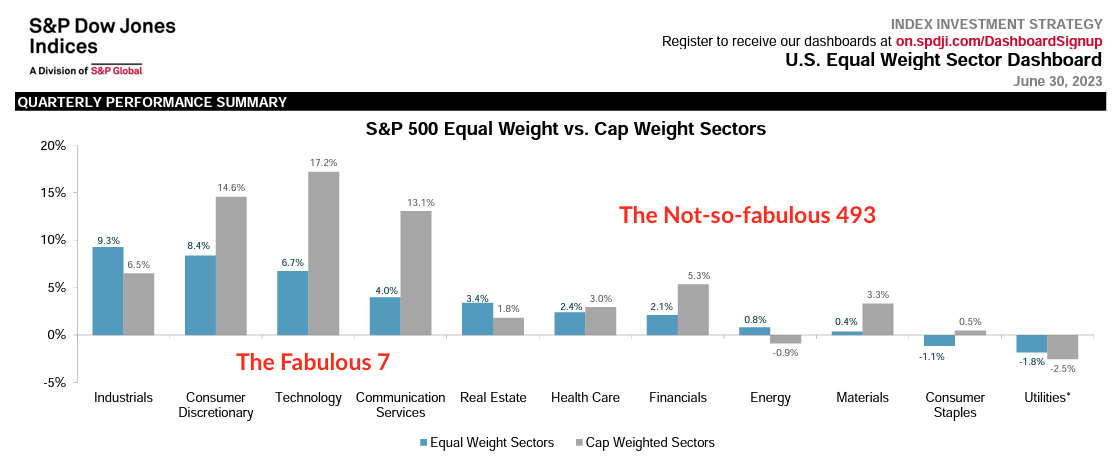
These beaten-down sectors have acted better of late. There’s increasing hope of a Goldilocks “soft landing” for the economy, which I’ll talk about in a moment. This has led to a modest broadening in the overall market’s rally. We see evidence of this in stabilizing performance of the equal-weight S&P index fund relative to the normal index.

I believe the answer to the question, “Will this rally broaden out?” still depends on the economic outlook. And on that front, I still have concerns that the economic Goldilocks won’t find her perfect soft landing.
Recession Delayed, But for How Long?
The resiliency of the US consumer, which powers over 70% of the economy, has surprised me. The Fed is running one of its most aggressive tightening cycles in a generation yet that hasn’t deterred spending. Why?
My view is that the wage picture for American workers has proven stronger for longer than many expected. Many wage surveys, including the popular Wage Growth Tracker by the Atlanta Federal Reserve show wages rolling over late in 2022. Weaker wage growth should mean weaker spending, but it hasn’t played out that way.

When stronger-than-expected economic data defies surveys that would’ve predicted weakness, it’s time to dig into the numbers a bit more. What I’ve done here is to look at the implied wages of all workers, determined from looking at monthly Medicare tax receipts by the Federal government. To me, this gives a better picture of what’s really going on versus a “survey” as we know the two key variables: 1) the monthly amount of Medicare tax received by the government, 2) the Medicare tax withholdings rate of 2.9%.
We then adjust these numbers to reflect inflation’s impact on worker wages. That’s key. Wages might go up, but if the cost of living goes up more, then that’s bad for the economy. Conversely, if wages are rising faster than inflation, then that’s increased spending power for the consumer; a good thing.
Inflation and Wages
The chart below summarizes these findings. The pandemic’s effect on the labor market distorts some data. But what we see is that over the last several months, there’s been a steady increase in inflation-adjusted wages.

Looking at this chart through the lens of how markets have acted the last 18 months, things make sense. The surge in inflation in 2021 and 2022 took a massive bite out of people’s spending power, at the same time the Federal Reserve started hiking interest rates. We experienced a rise in economic uncertainty and market volatility last year.
However, since late 2022, inflation has cooled while worker wages continue to grow. That means increased spending power, which means the consumer has held in there better than we expected.
The question is will this dynamic continue? If so, then holding 20% in a money market fund for fear of a recession is unnecessarily cautious. So what’s our view on this?
Despite the surprising strength in the consumer, we still believe a recession is coming. We’ll go through these reasons in the following sections.
Early Signs of Employment Weakness
If consumers are the reason for the strong economic growth we’ve seen, then we have to start by examining leading indicators of consumer health. The Atlanta Wage Growth Tracker chart above reveals a slowdown in growth of wages. But consumer spending power is a function of hours worked times wages.
Despite the unemployment rate sitting near historic lows at 3.6%, there’s been an unmistakable rise in the number of filing for unemployment insurance in the last nine months. While the absolute level of claims remains very low, the trend is up, not down.

Remember those weak-performing sectors that comprise the not-so-fabulous-493 we saw before? Well, those are big companies that employ many people. The profit squeeze they’re experiencing is real, and we know that when CEOs get cautious, jobs get cut.
We believe the combination of cooling wage growth and an increasing number of unemployed will stall consumer spending power, even if inflation continues to fall. That would lead to economic weakness. Recent earnings reports from cereal maker General Mills and snacks & soda group Pepsico may already point in this direction, as each company saw sales volumes drop, even as sales levels held up due to price increases.
Higher Interest Rates Lead to Corporate Stresses
Another indicator we’re watching closely is corporate health. For much of the last 15 years, large companies have enjoyed a bonanza of extremely low-cost debt, which allowed them to take out more debt than they could’ve otherwise. We touched on this in more detail in a blog post last November.
Companies that took out a lot of debt did one thing smartly: they took out long-term debt that they wouldn’t have to repay for several years. That’s why many companies have continued to operate normally despite interest rates increasing so much in the last 18 months.
But debt is coming due, and high-risk companies that could take out debt with 4% interest rates two years ago find that they have to pay 8% or more today. As old debt matures and has to get “rolled over,” we believe the incremental interest cost will prove too much for weaker companies.
This is showing up in the data, as the number of corporate bankruptcies has recently increased.

What worries us a lot is that the near-zero interest rate policy we had for much of the 2010s and early 2020s allowed the survival of weak companies that otherwise would’ve failed. Fully 45% of the 2000 small companies that make up the Russell 2000 small cap index generated no profits in the last 12 months despite very strong economic growth.

What’s going to happen if consumer spending slows and interest costs on debt rise? In our view, the combination of slowing wages, weakening employment and diminishing pricing power is going to take a greater bite out of corporate profits in the future.
Yield Curves Inverted Around the World
We’ve highlighted the inverted yield curve before as one of the key factors to our recession call. After 12 months since the curve first inverted, one can be excused for believing that this recession indicator isn’t working this time around. Many economists are saying this right now.
But in the immortal words of famed ESPN college football analyst, Lee Corso, we say, “Not so fast, my friend!” If you dig all the way back to 2019 in the FDS blog files, you’ll find an article we wrote about the predictive power of inverted yield curves and recessions. The table below is from that article.

The time gap between when the yield curve inverted and when a recession ultimately happened averages out to 16 months, but can take up to a year and a half. We are currently in Month 13 since the yield curve decisively broke into negative territory. More interesting is the fact that the yield curve is as inverted as it’s been in over 40 years.
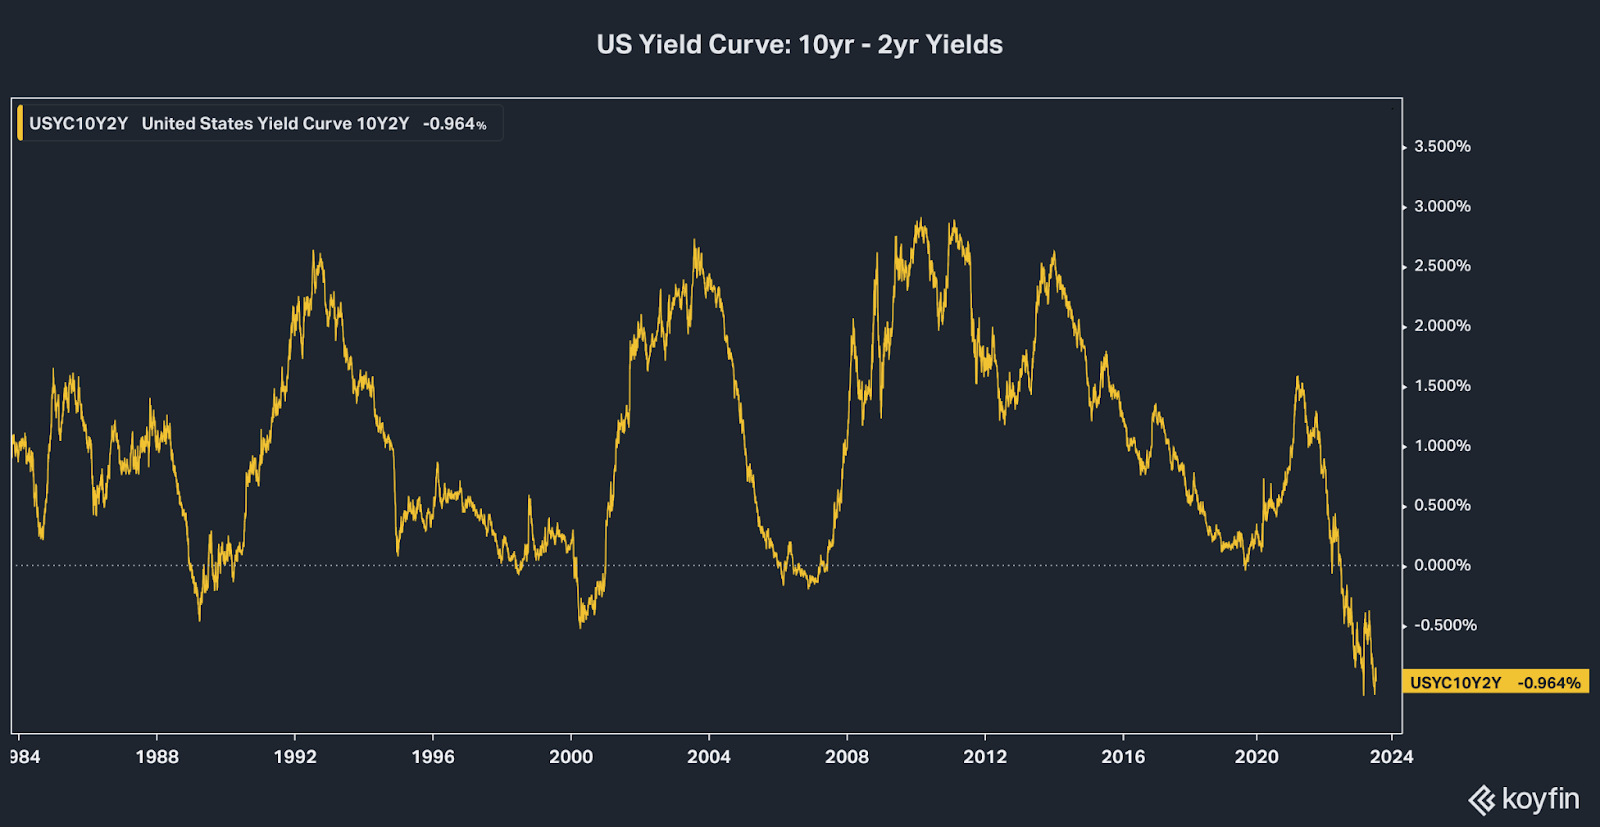
More recently, the yield curves of other global economies have also inverted, including the U.K., Canada, Australia, Germany, and other major European countries. It’s rare for the yield curves of major economies to be simultaneously inverted. Given the historic signaling of inverted yield curves and future recessions, we stay in the camp that this is a red flag for growth.
Bull Case: A Perfectly Executed Soft Landing
The Perfect Soft Landing is the case that markets appear to be discounting today. The thesis is this:
- The Fed reacted forcefully to surging inflation by hiking interest rates…
- Which is leading to inflation returning to more normal levels…
- Without causing unemployment to increase, or…
- Causing a financial accident.
I don’t dismiss that this might be happening. Inflation is indeed returning to more normal levels. And despite an uptick in unemployment claims, higher interest rates have had almost no impact on employment.
The problem I have with this thesis is that it would completely defy history. Going all the way back to the 1950s, there has never been a sustained increase in Fed policy rates without a recession happening soon after.

One would also have to believe that nobody took on excessive risks while living with interest rates near 0% for most of the 2008 to 2021 period. But there’s already been rumblings of borrower issues in the commercial real estate market. Let alone the fact that the cost of paying interest on U.S. government debt is rapidly overtaking the total cost of Social Security benefits in the U.S. budget.
We are certainly hopeful of this soft landing! That’s what we’re rooting for! But it’s hard to wave off hard logic and decades of historical evidence and believe that somehow, the Fed is going to execute a perfect landing this time around.
Sticking With Current Asset Allocation
There are few things that cause me grief more than knowing our clients have 20% of their normal stock allocation sitting in boring money market funds while stocks are up double digits. It’s been a drag on year-to-date performance, for sure. I kick myself for not re-allocating at least a portion of that cash back into the market when stocks were down 20% late last year.
But we’re tasked with guiding you towards your financial goals over the long haul. And the thing that keeps me on the “sidelines” is my belief that the next decade is going to prove much more difficult for investors to navigate. I’m wary of going back “all in” on stocks until the full impact of the historic rise in Federal Reserve short-term rates is made apparent. Waiting for policy time lags (i.e. the time from when rates rise to when the impact is felt) always seems to take longer than you think it will. But history says we WILL feel those effects.
Even with the performance drag from cash, client portfolios are up almost a full year’s worth of gains that we project on a long-term basis. That means those long-term goals of retiring early, or traveling, or donating to favorite charities is on-track. And those are the things that really matter.
Next Steps in this Bullish Market
You will probably see more trading activity in accounts in the future as we’ll be even more tactical to take advantage of market dislocations when they arise. For example, we may reallocate some money market funds back into stocks temporarily, if prices become attractive. We make each investment decision in the context of where we believe we are in the long-term cycle.
We as a team are extremely grateful for every one of you. It’s fun to help clients work through new challenges and opportunities. As always, the entire team is here to serve you to answer questions and work on new financial goals or issues you may have.
Ready to take the next step?
Schedule a quick call with our financial advisors.